The Ethernet menu contains a list of links for accessing the different diagnostic pages for the Ethernet module:
Click a link to access the desired diagnostics utility.
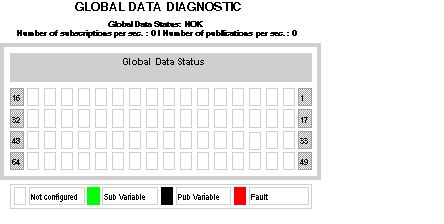
Information on the general diagnostics of Global Data can be found at the top of this page:
This page also shows a table of published and subscribed variables in the same distribution group. Each variable is identified by its Identifier:
-
Green for the subscribed variables
-
Black for the published variables
-
White for unconfigured variables
-
Red for variables with communication interruptions
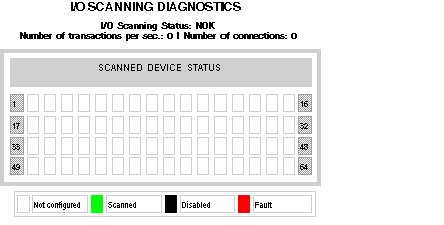
General diagnostics for the I/O scanning service are shown at the top of this page:
A value of NOK in the I/O Scanning Status field indicates that the local system is not scanning. In this case, any data that appears in the Scanned Device Status display is meaningless.
A value of OK in the I/O Scanning Status field indicates that the values in the Scanned Device Status display are reporting the state of scanned devices.
In the Scanned Device Status display, the colors that appear in each block indicate the following states for specific remote devices:
-
Green indicates that a device is being scanned
-
Black indicates that I/O scanning of the specific device has been intentionally disabled via the Device Control Block
-
White indicates an unconfigured device
-
Red indicates a suspect device
NOTE: Be aware that the green
Scanning indicator may incorrectly remain green for a remote scanned device after the Ethernet cable gets removed from that device. This inaccurate indication occurs when the health timeout value in the
I/O Scanning configuration screen is set to 0.
You should configure an operational health timeout value in the range 1...65535 (in 1 ms increments). If the health timeout value is set to any value in this range, the Scanning indicator reports I/O scanning health correctly.
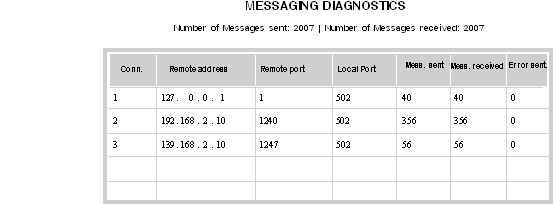
This page provides current information on the open TCP connections on port 502.
The number of sent/received messages on the port can be found at the top of this page.
A table provides, for each connection (numbered from 1 to 64):
-
remote IP Address
-
remote TCP port
-
local TCP port
-
number of messages sent from this connection
-
number of messages received from this connection
-
detected event number on this connection
NOTE: Following a request to close a connection, the PLC may hold the connection open in its memory for a few minutes, during which the table will reflect the open connection.
Number of Messages received is not reset after a port 502 connection is closed. Therefore, the count indicates the total number of messages that have been received since the module was started.
The remote address ‘127.0.0.1’ is used as Private System Connection For Diagnostic Feature or SOAP Communications.
Bandwidth Monitoring Page
This page displays the load distribution of the Embedded Server module between the Global Data utilities, I/O Scanning, Messaging, and other utilities:
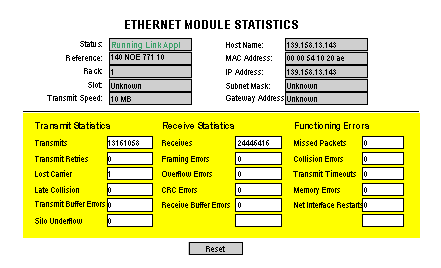
The Ethernet Module Statistics page provides information about the status, transmit and receive statistics, and detected errors for the Embedded Server module. Access this page by selecting the NOE module from the local rack or use the hyperlink Statistics. The following graphic is an example Ethernet Module Statistics page:
NOTE: Refer to Modicon Quantum Ethernet TCP/IP Module User Guide (840 USE 107) and Modicon Quantum Ethernet TCP/IP Module User Guide (840 USE 115) for definitions of terms.
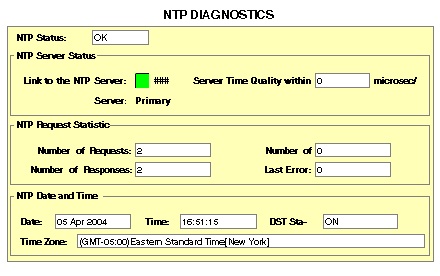
Time synchronization service parameters:
|
Parameter
|
Description
|
|
NTP status
|
Service is correctly configured (OK)
|
|
NTP server status
|
NTP client is connected to the NTP server, and if the server is Primary or Standby
|
|
NTP requests
|
Total number of client requests sent to the NTP server
|
|
NTP responses
|
Total number of server responses sent from the NTP server
|
|
Number of errors
|
Total number of unanswered NTP requests
|
|
Last error code
|
Last detected error code received from the NTP client
|
|
Date
|
Date in d/m/y format
|
|
Time
|
Time
|
|
Time zone
|
Time zone plus or minus Universal Time, Coordinated (UTC)
|
|
DST
|
Daylight saving time (DST) parameter is either
-
on (enabled)
-
off (disabled)
|
Last Error field displays values, which indicate the type of detected event.
|
Type of detected event
|
Value
|
|
Component OK and running
|
0
|
|
Excessive network traffic or server overload
|
1
|
|
Bad parameters in the configuration
|
3
|
|
Component is disabled
|
4
|
|
Incorrect IP
|
9
|
|
Time zone file absent
|
14
|
|
Incorrect syntax in the customrules file
|
15
|
|
Parameter
|
Description
|
|
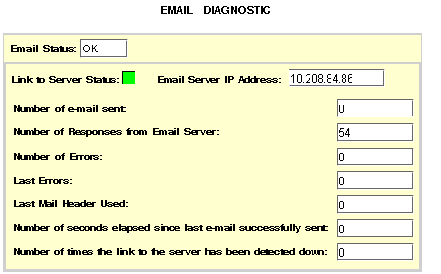
Email status
|
Email service is correctly configured (OK).
|
|
Link to Server Status
|
Ethernet module is connected to the SMTP server.
Status is checked at start-up and at least every 30 minutes after start-up:
|
|
SMTP Server IP Address
|
IP address of the SMTP server
|
|
Number of e-mails sent
|
Total number of e-mails sent successfully
|
|
Number of Responses from SMTP Server
|
Total number of SMTP messages received from the SMTP server
|
|
Number of Errors
|
Total number of e-mails not sent because of a detected error
|
|
Last Errors
|
Reason for the last detected error with a code in hexadecimal.
0 indicates no detected error.
|
|
Last Mail Header Used
|
Last header used by giving the number.
|
|
Number of seconds elapsed since last e-mail successfully sent
|
Counts the number of seconds since the last email was successfully sent.
|
|
Number of times the link to the server has been detected down
|
Number of times the SMTP server could not be reached. (Link checked every 30 minutes.)
|
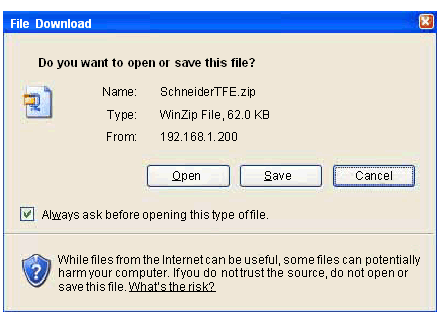
When you select Upload MIB File, the File Download dialog box appears. You are asked if you want to save the MIB file or open it:
Crash Log Diagnostics Page
The Crash Diagnostics Page displays a crash log file when an unrecoverable event has occurred, and a status message otherwise.
