|
Local Slave / Connection Diagnostics
|
|


|
(Original Document)
|
|
Local Slave / Connection Diagnostics
|
|
|
(Original Document)
|
|
When the checkbox is...
|
This page...
|
|---|---|
|
Selected
|
|
|
De-selected
|
|
|
Step
|
Action
|
|---|---|
|
1
|
In the DTM Browser, select the communication module and click the right mouse button. A pop-up menu opens.
|
|
2
|
In the menu, select Device menu → Diagnostic.
|
|
3
|
In the left pane of the Diagnostic window, click on one of the following:
|
|
4
|
Depending upon you selection in step 3, above, click on either the Local Slave Diagnostic tab or the EIP Connection Diagnostic tab to open that page.
|
|
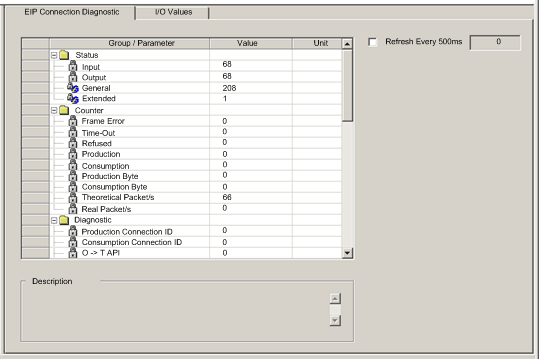
Parameter
|
Description
|
|---|---|
|
Input
|
An integer representing input status.
|
|
Output
|
An integer representing output status.
|
|
General
|
An integer representing basic connection status.
|
|
Extended
|
An integer representing extended connection status.
|
|
Counter:
|
|
|
Frame Error
|
Increments each time a frame is not sent by missing resources or is impossible to send.
|
|
Time-Out
|
Increments each time a connection times out.
|
|
Refused
|
Increments when connection is refused by the remote station.
|
|
Production
|
Increments each time a message is produced.
|
|
Consumption
|
Increments each time a message is consumed.
|
|
Production Byte
|
Total of produced messages, in bytes, since the communication module was last reset.
|
|
Consumption Byte
|
Total of consumed messages, in bytes, since the communication module wa last reset.
|
|
Theoretical Packets per second
|
Packets per second calculated sing current configuration value.
|
|
Real Packets per second
|
Actual number of packets per second generated by this connection.
|
|
Diagnostic:
|
|
|
Production Connection ID
|
The connection ID.
|
|
Consumption Connection ID
|
The connection ID.
|
|
O -> T API
|
Accepted packet interval (API) of the output connection.
|
|
T -> O API
|
Accepted packet interval (API) of the input connection.
|
|
O -> T RPI
|
Requested packet interval (RPI) of the output connection.
|
|
T -> O RPI
|
Requested packet interval (RPI) of the input connection.
|
|
Socket Diagnostics:
|
|
|
Socket ID
|
Internal Identification of the socket.
|
|
Remote IP Address
|
IP address of the remote station, for this connection.
|
|
Remote Port
|
Port number of the remote station, for this connection.
|
|
Local IP Address
|
IP address of the communication module, for this connection.
|
|
Local Port
|
Port number of the communication module, for this connection.
|
|
Input/Output Status (dec)
|
Description
|
|---|---|
|
0
|
OK
|
|
33
|
Time-out
|
|
53
|
IDLE
|
|
54
|
Connection established
|
|
58
|
Not connected (TCP)
|
|
65
|
Not connected (CIP)
|
|
68
|
Connection establishing
|
|
70
|
Not connected (EPIC)
|
|
77
|
Scanner stopped
|
