Overview
The notification pane lets you view and trace engineering activity. The pane is displayed automatically when the Topology Manager opens. It contains two tabs:
: Indicates the status of actions and events.
: Provides details of actions when available.
You can sort, filter, and copy to the Clipboard the information that is displayed.
Both tabs feature a search functionality. Further, you can customize the order of columns and select which ones appear.
Tab Description
The tab displays information about events at the Topology Manager infrastructure level and actions at the system project level. The information that is displayed is the same for each Control Expert instance that connects to the same system server independently of the system projects that are open.
When a second Topology Manager instance opens, you can see in this tab the history of actions starting from the moment the first instance got connected to the system server.
Certain system server tasks are displayed as well (for example, the server shutting down).
An entry is logged when you initiate an action and it is updated when its execution is complete. A colored icon indicates the status of the action. For certain actions, details are available in the tab.
The information remains available as long as the system server to which Control Expert is connected is running. Closing Control Expert does not delete the entries. However, you can clear the entries.
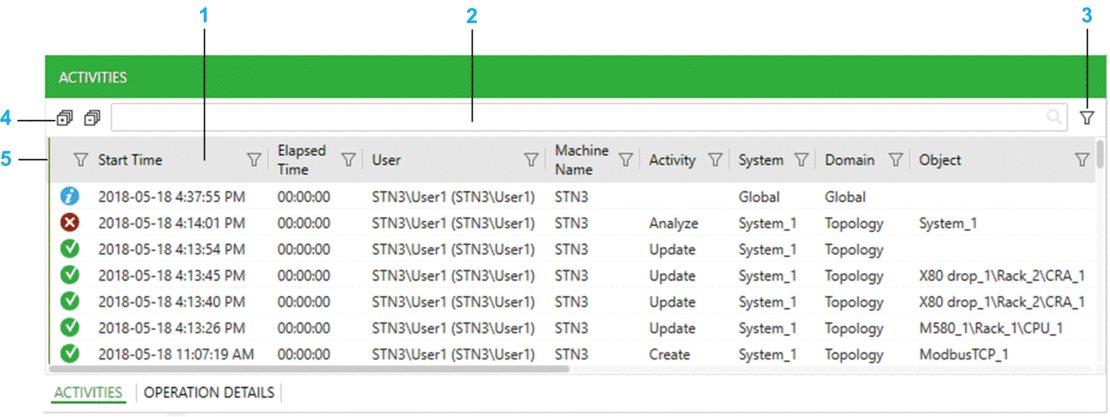
The following figure shows an example of the tab.

| Item | Description |
| 1 | You can shift columns; the order of columns is persisted for each Topology Manager instance running on the computer. To show/hide a column, right-click any column header and select/clear the column respectively. You can filter, and sort data in columns. |
| 2 | Enter one or more strings (not case sensitive, separated by a space) in the text field to show only entries that contain the string (an OR operator is applied to searched strings). Only columns containing data that is related to system project objects are searched (for example, is not). The string is highlighted in each row. The filter remains active until you clear the string. You can use the other filter and sorting features in addition. |
| 3 | Button to toggle the grouping bar. |
| 4 | Expands/collapses data when it is grouped. |
| 5 | Drag the line horizontally along column headers. It freezes any columns that are to the left of the line when you use the horizontal slider. To unfreeze columns, drag the line all the way to the left. |
The table describes the information that appears in the columns of the tab.
Column header |
Description |
|---|---|
Status icons |
|
|
|
|
|
|
|
|
|
|
|
|
Date and time when the action was initiated. |
|
The time it took to execute the action independently of its final status. |
|
Name that was entered to log in to the Control Expert instance (Topology Manager). If actions are recorded before you log in, the column indicates Domain\Username where Username is the user who is logged in to the computer on which the action is initiated. |
|
Name of the computer on which the action was initiated. |
|
Keyword describing the action that was executed. Typically, this corresponds to the command you selected. |
|
Identifier of the system project in which the action was executed. If it is not related to a system project, is indicated. |
|
Identification of the domain or system project component on which the action was executed. When the action or event is not related to a system project (for example, when a user logs in), is indicated. |
|
Full name of the device, module, communication card, port, or object (for example, a physical link or logical network) of the system project on which the action was executed. |
|
Short description of the action that was executed. |
(1) Corresponding keyword when you copy and paste the information of an entry. |
|
Viewing Details of an Action
To view more detailed information about an action in the tab, you can:
Select an action in the tab and click the tab.
Double-click an entry in the tab.
Select the command in the context menu of an entry.
If no details are available, the tab is not shown or empty.
tab Description
The tab serves the following purpose:
Displays more detailed information about activities displayed in the tab.
Displays diagnostic information about transversal activities (such as build or import tasks) that are performed by any user on the system project, which is open in the Topology Manager.
Lets you locate a device for which information is displayed by double-clicking the corresponding entry in the tab.
When details for an action or event are available, you can view them as long as the corresponding entry in the tab is present.
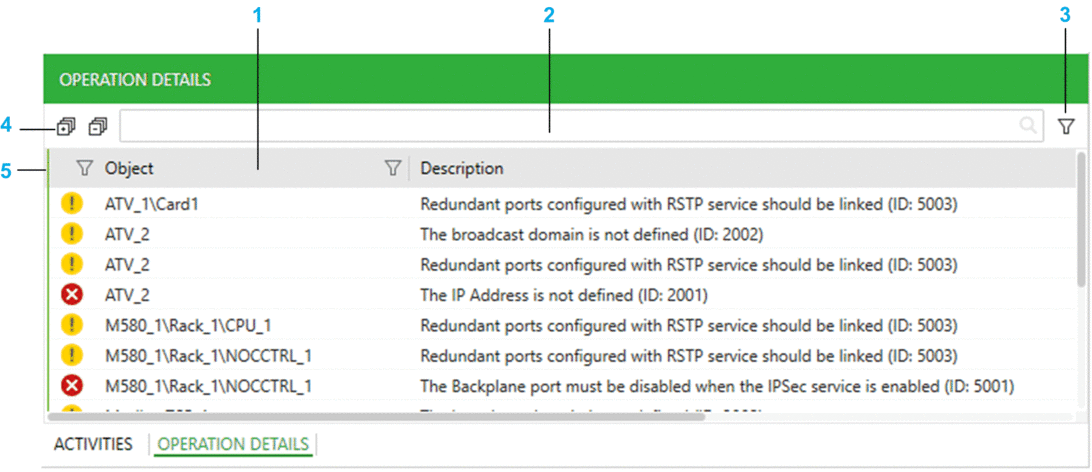
The following figure shows an example of the tab.

| Item | Description |
| 1 | You can shift columns; the order of columns is persisted for each Topology Manager instance running on the computer. To show/hide a column, right-click any column header and select/clear the column respectively. You can filter, and sort data in columns. |
| 2 | Enter a string (not case sensitive) in the text field to show only entries that contain this string in either column. The string is highlighted in each row. The filter remains active until you clear the string. You can use the other filter and sorting features in addition. |
| 3 | Button to toggle the grouping bar. |
| 4 | Expands/collapses data when it is grouped. |
| 5 | Drag the line horizontally along column headers. It freezes any columns that are to the left of the line when you use the horizontal slider. To unfreeze columns, drag the line all the way to the left. |
The table describes the information that appears in the columns of the tab.
Column header |
Description |
|---|---|
(Status) |
Icons indicate the severity:
|
|
Name of the object, such as device, module, communication card, port, logical network of the system project to which the information applies. For example, M580_1\Rack_1\M580CPU_1 |
|
Short description of the detected error, alert, or information message. The ID in brackets refers to the rule that is not satisfied. |
(1) Corresponding keyword when you copy and paste the information of an entry. |
|
Message Actions
The table describes the context menu commands of entries in the or tab.
Command |
Description |
|---|---|
|
Shows the tab and displays additional information about the selected action. NOTE: The command
appears only in the tab and is enabled when additional information is available.
|
|
Copies the content of the selected entry to the Clipboard. You can paste the information contained in each column in comma-separated format. The column headers are not copied. NOTE: You can only copy information
of one entry at a time.
|
|
Commands are available only for entries related to devices or modules, NICs, communication cards, and ports. |


 In progress (spinning).
  Completed successfully (green).
  Not completed successfully
(red).
  Completed with notifications (yellow).
  Information (blue).
  Action canceled by the user
(red).