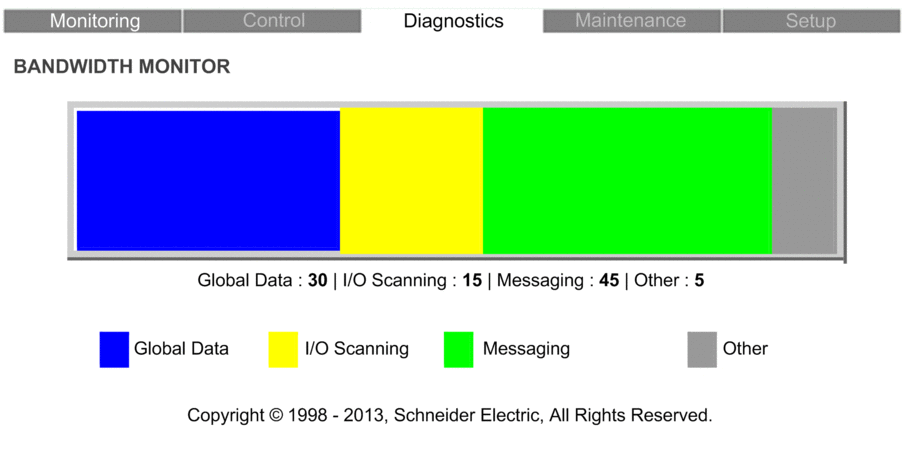
Introducing the Bandwidth Monitoring Page
The page provides dynamically updated data about the current usage of Ethernet bandwidth.
Accessing the Bandwidth Monitoring Page
Access the page from the Diagnostics menu. In the navigation menu at the left side of the page, select .

Bandwidth Monitoring Page Display
The page presents the current percentage usage of Ethernet bandwidth, in both text and bar graph format:
Color |
The percentage of bandwidth used by... |
|---|---|
Blue |
Global Data messages |
Yellow |
I/O Scanning messages |
Green |
Modbus Messaging |
Gray |
Other messages, or not used |


