Introducing the Global Data Page
The 171 CBU 98091 includes the diagnostic web page.This page contains diagnostic data describing the status of the service.
Accessing the Global Data Page
Access the page from the Diagnostics menu. In the navigation menu at the left side of the page, select .
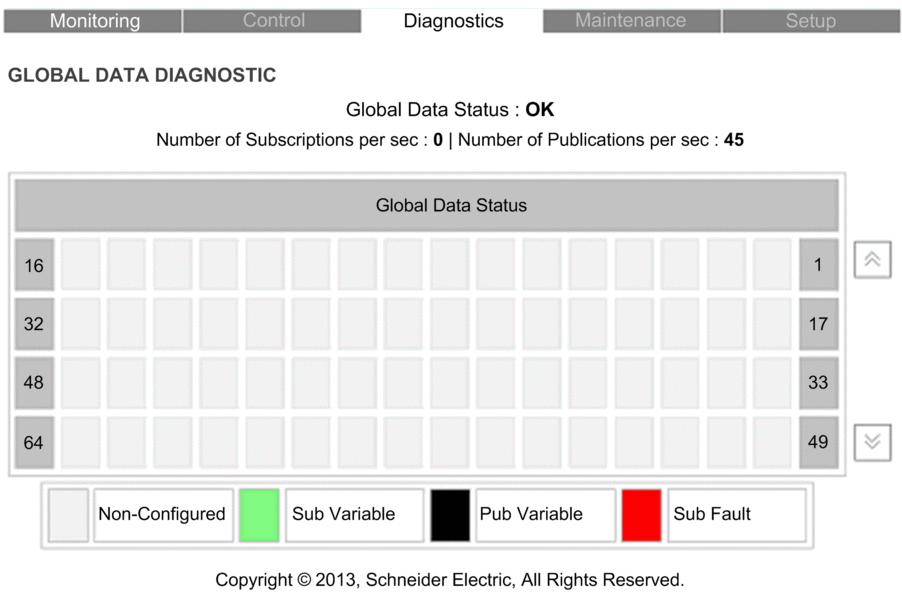
An example of the page:

The top of this page displays the following read-only diagnostic data for the service:
Global Data Status indicates the status of the service:
OK = operational
NOK = not operational
Number of Subscriptions per second
Number of Publications per second
The page also presents a table representing the nodes in the Global Data distribution group. The color of each table cell indicates the status of that node:
Color |
Variable Status |
|---|---|
green |
subscribed variable |
black |
published variable |
white |
no published variable and no subscribed variable |
red |
detected communication error for a node that has subscribed to a variable |


