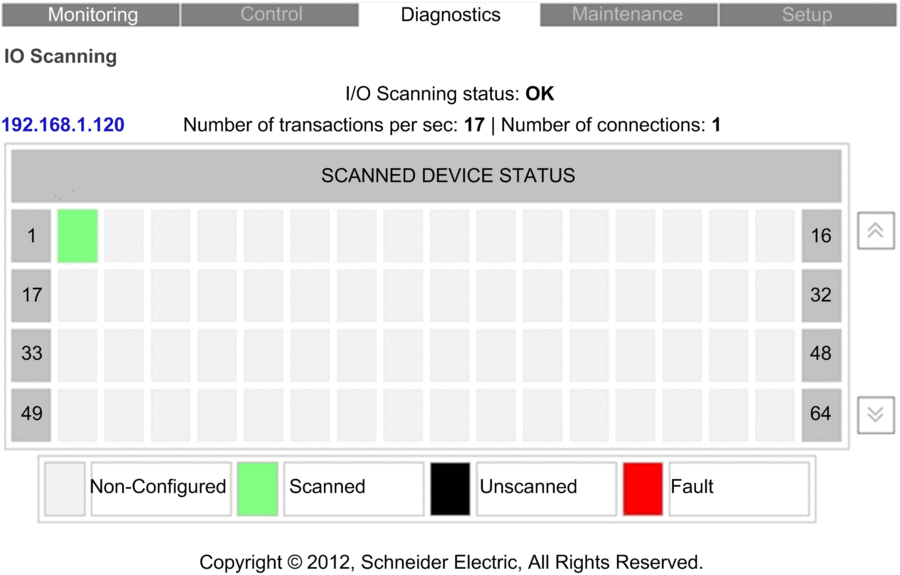
Introducing the IO Scanning Page
The page displays read-only data describing the current state of the processor in its role as I/O scanner.
Accessing the IO Scanning Page
Access the page from the Diagnostics menu. In the navigation menu at the left side of the page, select .

IO Scanner Display
The top of the page displays the following general diagnostic information about the scanner:
:
indicates that the values in the grid represent the state of scanned devices.
indicates that the processor is not scanning. In this case, any data that appears in the grid is meaningless.
In the grid, the colors that appear in each block indicate the following states for specific remote devices:
GREEN indicates that a device is being scanned.
BLACK indicates that I/O Scanning of the specific device has been intentionally disabled.
GRAY indicates a device that is not configured.
RED indicates a suspect device.
When you place your mouse pointer on a block representing a configured remote device, its IP address is displayed on the top left of the table. When you select a block representing a configured remote device, the home page of the device is displayed (if the device includes an embedded web server).


