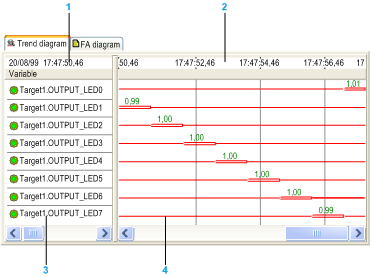
The trend diagram represents the sequence of the system's developments. The display is similar to that of a pen recorder. It can be accessed from the Trend diagram tab in every recording window.
1
Date and time: The date displayed on the left-hand side of the dating scale is that of the trend diagram's left edge. This date changes as you move on the diagram.
2
Dating scale: The dating scale enables you to date the different developments in the recording. You can place time stamps or select the mechanical mode display using this scale.
3
Statistical Table: The data table on the left-hand side of the trend diagram area provides information related to variable statistics.
4
Signal trend diagram: Each variable is displayed according to numerous display options. You can obtain additional information on displayed developments by moving the mouse pointer over them. You can also superimpose your recording with reference cycles saved beforehand.
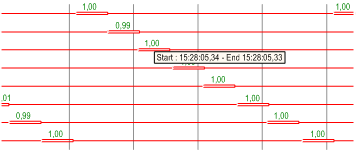
In addition to the display of the developments along with their duration, the Trending Tool trend diagram can easily give you the exact position of every development:
-
Move the mouse pointer onto one of the diagram's developments.
-
Wait for approximately 5 seconds without moving the mouse: Trending Tool will display a small pop-up window featuring the start time and end time of the pointed development.
-
Move the mouse to close this window.
You can expand the trend diagram line, by following the steps below, to help you use analogical variables:
-
Right click on the trend diagram to display the context-sensitive menu.
-
Click on
Select line height and select the height required as described in
display tab menu.

