At a Glance
A trend diagram allows the graphic representation of a variable status, with the representative curve moving from right to left.
You are advised to limit the number of trend diagrams on a same page because their display decreases the system’s performance.
Only rectangular type objects can be used as trend diagrams.
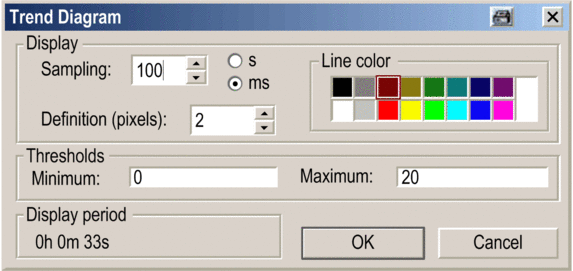
Trend diagram parameter screen
The screen below allows to parameter the animated rectangles of the trend diagram format.

Description
The table below describes the settings that you may define.
Attribute |
Description |
|---|---|
Sampling |
Period in which a new value is added at the end of the diagram and the diagram is refreshed. Default value: 1 second. When the sampling period is given in seconds, values between 1 and 3600 are allowed. When it is given in milliseconds, the allowed range is 1 to 9999. Sampling periods below 100 ms produce a lot of windows messages and generate a high CPU load. Therefore only few diagrams with such small periods should be animated at the same time and long lasting actions like should be avoided while diagrams are animated (see also the NOTE at the end of the table). |
Definition |
Length of value display. Each new value is represented by a right segment whose length is fixed by the definition. The definition is expressed in pixels between 1 and 20. The value by default is 2. |
Line color |
Color of the timing diagram’s right segments The colors palette contains 16 predefined colors and provides access to the extended colors parameter screen. |
Threshold: minimum and maximum |
Thresholds between which the value representation develops. For binary values, the thresholds must be 0 and 1. |
Display period |
This value is calculated. It depends on the size of the rectangle, the sampling value and the definition. The procedure is as follows: Period = Rectangle size / Definition x Sampling. |


