

Open the Page
Access the page from the tab ():
NOTE:
Move the mouse over the dynamic graphs to see the current numeric values.
This page is updated every 5 seconds.
Diagnostic Information
This table describes the performance statistics:
Field |
Description |
|---|---|
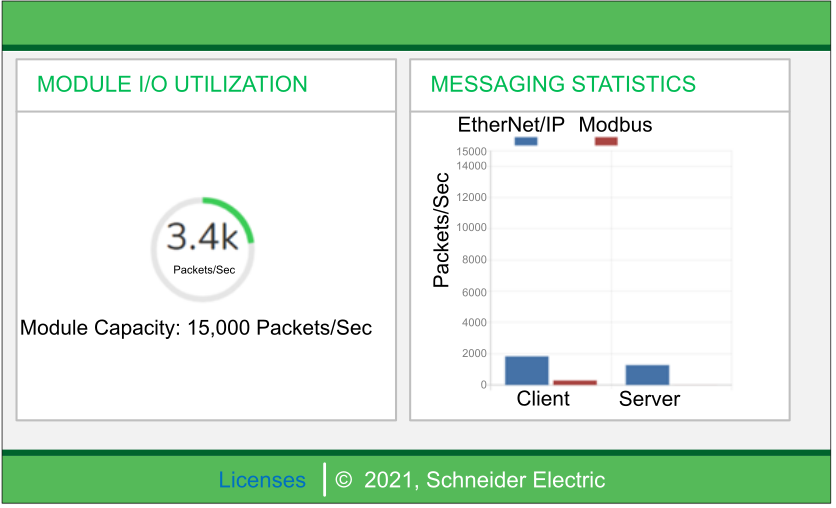
|
This graph shows the total number of packets (per second) the CPU can handle at once. |
|
This graph shows the number of Modbus/TCP or EtherNet/IP messages per second for the client or server. |