

Open the Page
Access the page from the tab ():
NOTE: This page is updated every 5 seconds.
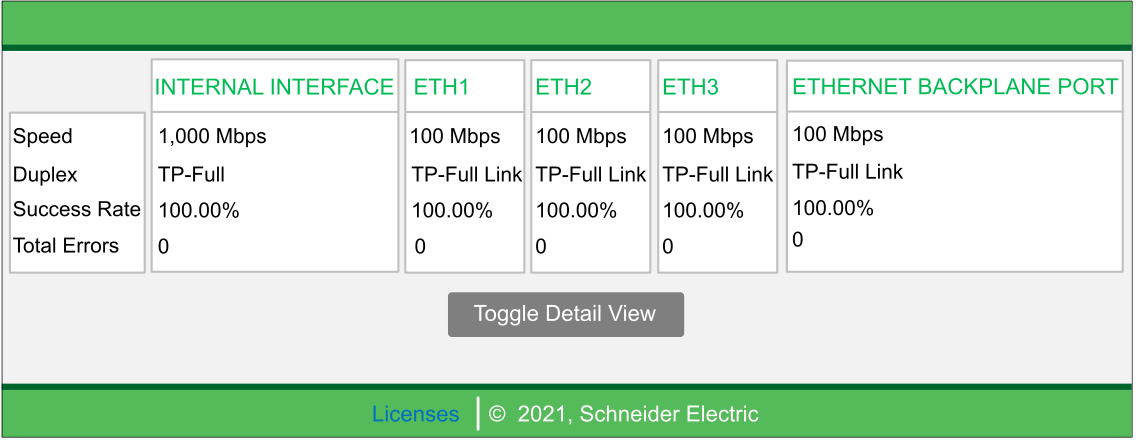
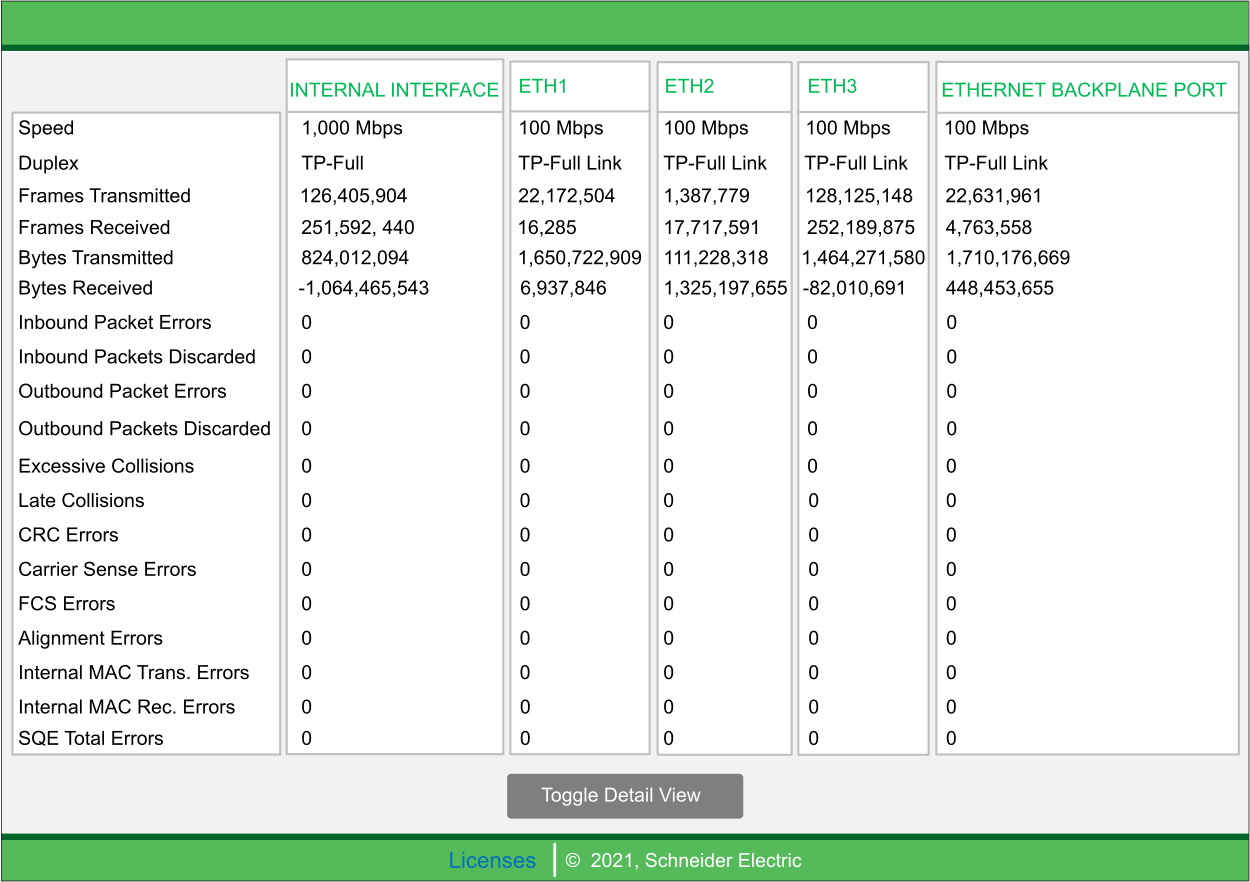
Click to change between the detail and non-detail view of the page.
NOTE: This page is updated every 5 seconds.
Diagnostic Information
This page shows the statistics for each port on the CPU. This information is associated with the configuration of the Ethernet ports and the configuration of the service/extended port.
The frame color indicates the port activity:
green: active
gray: inactive
yellow: error detection
red: error detection