This screen is used to access monitoring of all configured devices.
The screen lists the configured connection points as well as points 0 and 63.
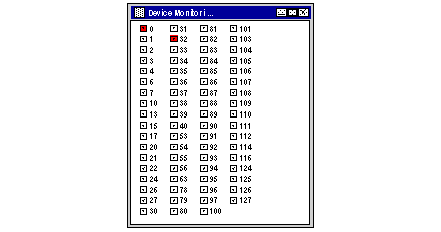
The device screen looks like this:
The following elements are associated to each connection point:
While the screen is open, the report variables of all connection points are read cyclically.
When the screen is opened or upon reset, the values of the counters for each report variable are stored to constitute a reference state. The time between two reads of the same variable is equal to the number of devices configured + 2 (0 and 63) in seconds.
A connection point is considered to be faulty if the value of one of its fault counters has changed from the reference state. When the point is faulty, the icon is shown in red.
Diagnostics are only sent back if a communication is established between the bus manager and the faulty connection point. The faults are signaled for fault counters defined by the WORLDFIP standard.
How to Deactivate Device Monitoring
The following procedure describes how to deactivate monitoring of a device on the bus.
|
Step
|
Action
|
|
1
|
Click on the check box of the connection point to be deactivated.
Result:
The box is unchecked In this case, the report variable of this connection point is no longer read and its reference state is reset.
|
How to Reset the Reference State
The following procedure describes how to reset the reference state.
|
Step
|
Action
|
|
1
|
Right click on the background.
Result: a shortcut menu appears.
|
|
2
|
Select the Reset command.
|