The Ethernet menu contains a list of links for accessing the Ethernet module’s different diagnostic pages:
A link also allows the private MIB source file to be downloaded.
Click on a link to access the desired diagnostics page.
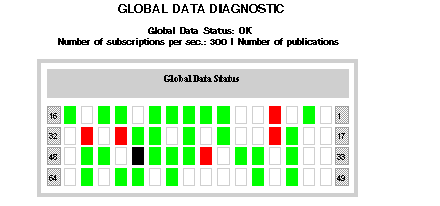
This page also shows a table of the published and subscribed variables in the same distribution group. The nature of each variable is identified by a color code:
-
green: subscribed variables
-
black: published variables
-
white: unconfigured variables
-
red: variables with detected communication faults
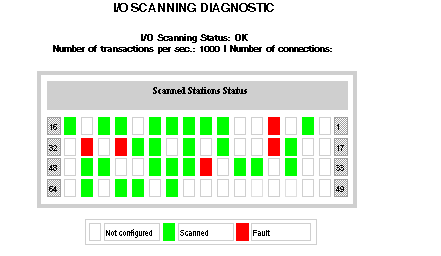
This page also displays a summary of the status of modules with color coding:
-
green for the scanned modules
-
white for the unconfigured modules
-
red for suspect modules
-
black for the modules that are temporarily unscanned.
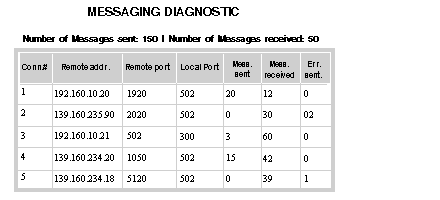
The Messaging page provides current information on the open TCP connection on port 502.
The number of sent/received messages on the port can be found at the top of this page. For each connection (numbered from 1 to 64), a table provides:
-
the remote IP address (Remote addr.)
-
the remote TCP port (Remote port:)
-
the local TCP port (Local Port)
-
the number of messages sent from this connection (Mess. sent)
-
the number of messages received from this connection (Mess. received)
-
the detected error number on this connection (Err. sent)
NOTE: Following a request to close a connection, the PLC may hold the connection open in its memory for a few minutes, during which the table will reflect the open connection.
Number of Messages received is not reset after a port 502 connection is closed. Therefore, the count indicates the total number of messages that have been received since the module was started.
The remote address ‘127.0.0.1’ is used as Private System Connection For Diagnostic Feature or SOAP Communications.
Bandwidth Monitoring Page
The Bandwidth Monitoring page shows the load distribution of the TSX ETY 4103/5103 module between the Global Data, I/O Scanning, Messaging and other services:
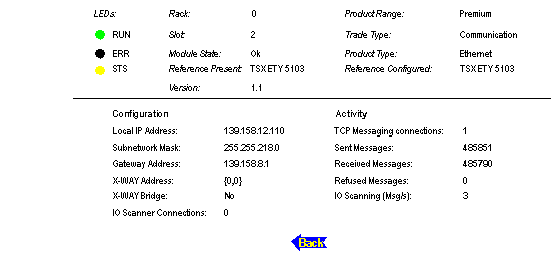
When you click the Embedded Server module in the Rack Viewer, you reach the Ethernet Module Statistics page. This page provides up-to-date information about the status, configuration, and activity of the Embedded Server module.
Here is an example of an Ethernet Module Statistics page.
The LEDs in the upper left-hand corner of the screen provide a dynamic report on the Embedded Server module status.
|
LEDs
|
Color if On
|
Meaning if On
|
Meaning if Blinking
|
Meaning if Off
|
|
RUN
|
Green
|
Running normally
|
---
|
Power Off
|
|
ERR
|
Red
|
Module detected error
|
Not configured
|
Running normally
|
|
STS
|
Red
|
Invalid network address or station out of range
|
---
|
OK
|


