|
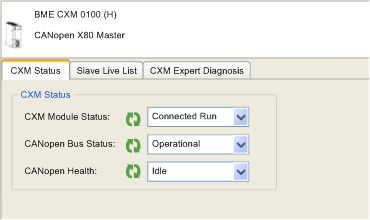
BMECXM DTM Diagnosis
|
|
|
Original instructions
|
 CAUTION CAUTION |
|
MISINTERPRETATION OF DIAGNOSIS
Make sure that you are connected to the right BMECXM CANopen master module before diagnosing a CANopen slave device.
Failure to follow these instructions can result in injury or equipment damage.
|
|
Step
|
Action
|
|---|---|
|
1
|
Open the Control Expert DTM Browser (Tools → DTM Browser).
|
|
2
|
Find the name that is assigned to the BMECXM module.
|
|
3
|
Right-click on the module name
|
|
4
|
Scroll to Connect.
|
|
Step
|
Action
|
|---|---|
|
1
|
Right-click the name that is assigned to your BMECXM module in the DTM Browser.
|
|
2
|
Scroll to Device Menu → Diagnosis to view the available diagnostics pages.
 |
|
Parameter
|
Type
|
Description
|
|---|---|---|
|
CXM Module Status
|
BYTE
|
Indicates the status of the module:
|
|
CANopen Bus Status
|
BYTE
|
Indicates the status of the CANopen bus:
|
|
CANopen Health
|
BYTE
|
Indicates the status of the fieldbus:
|
|
Color
|
General Device Status
|
|---|---|
|
White
|
CANopen node not used
|
|
Green
|
OPERATIONAL
|
|
Orange
|
PRE-OPERATIONAL
|
|
Red
|
ERR (Configured with fault)
|
|
Half Red/Orange
|
FAULT (Inoperative)
|
|
Half Orange/White
|
DISABLE (Configured)
|
|
Yellow
|
STOPPED
|
|
Group
|
Displays parameters available in ...
|
|---|---|
|
Info
|
|
|
Status
|
|
|
EIP Parameters
|
|
|
IO Connections
|
|
|
Fieldbus info
|