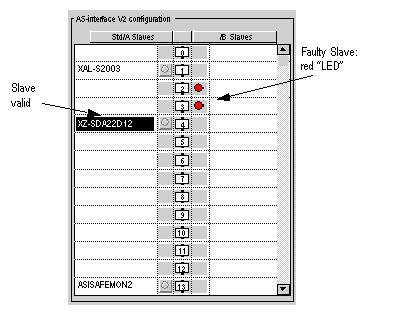
The lower part of the communication module’s debug screen is reserved for AS-i V2 bus diagnostics.
The slave devices connected to the bus are displayed in the two columns of the AS-interface V2 Configuration zone. The left hand column lists standard (A) or extended (B) address slaves, and the right hand column lists only extended address (B) slaves only. An icon shows the status of the slave number.
Illustration
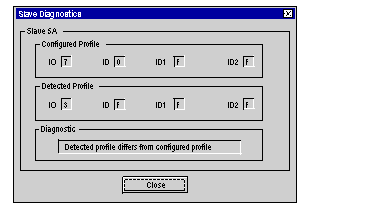
When you click on the slave button, a window shows the status of the slave, as shown in the diagram below:
The Slave Diagnostics window displays the following faults for each slave device:
-
A configured profile is specified but no slave is detected.
-
A profile is detected but there is no configured slave profile.
-
A profile is detected but a different profile is specified in configuration (I/O, ID, ID1 or ID2).
-
The peripheral fault, if the slave supports it.
NOTE: The Profile field in the Slave Zone in the debug screen allows you to check if the profiles of the specified (Configured) slave and the Detected slave are identical.