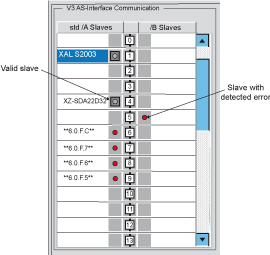
The lower part of the communication module debug screen is reserved for AS-Interface bus diagnostics.
The slave devices connected to the bus are displayed in the two columns of the V3 AS-interface Configuration zone. The left hand column lists standard or extended slaves (std/A Slaves). The right hand column lists only extended slaves (/B Slaves). A red “LED” shows the status of the slave at the AS-Interface address.
A red LED indicates a detected error because the slave is:
-
Configured, but not detected
-
Detected, but not configured
-
Detected with profile different from the configured profile
-
Inoperative, i.e., a peripheral error (if supported by the slave)
Illustration
NOTE: As 6.0.F.C above shows. when there is a detected error on a slave with a S-6.0 profile, all of its virtual “slaves” are also indicated to have detected errors.
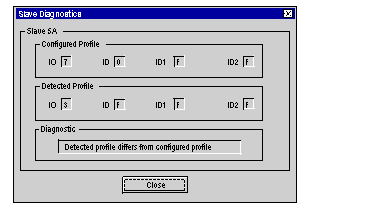
Clicking on a slave with a detected error opens the Slave Diagnostics window that shows the status of the slave:
This window displays the following detected errors for each slave device:
-
Slave configured but not detected
-
Slave detected but not configured
-
Detected profile differs from configured profile (I/O, ID, ID1 or ID2)
-
Peripheral fault)
NOTE: The Profile field in the Slave Zone in the debug screen allows you to check if the profiles of the specified (Configured) slave and the Detected slave are identical.

