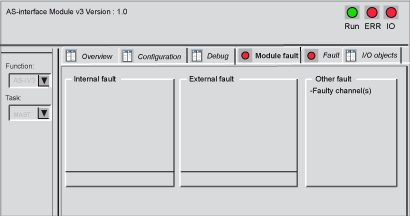
The module and channel diagnostic functions display the current detected errors classed according to their category:
-
Internal detected errors in, for example, software, communication with the CPU, configuration, parameter settings and commands
-
External detected errors, for example, an inoperative slave, AS-Interface power supply switched off, terminal anomaly, difference between physical configuration and Control Expert configuration)
-
Other detected errors, for example, the BMX EIA 0100 absent or switched off)
Detected errors in the module and channel are indicated by “LEDs” on the displays changing to red, such as in:
-
Rack configuration screen by the presence of a red square on the image of the AS-Interface module
-
All the module level screens (Description and Default tabs): in the module zone with the LED I/O
-
All the channel level screens (Description, Config, Debug and Default tabs) in:
-
Fault screen accessible with the Fault tab where the error diagnostics are described
The detected error is also signaled:
Procedure for Accessing Module Diagnostics
The procedure below accesses the screen Module diagnostics:
|
Step
|
Action
|
|
1
|
Open the AS-Interface module to be diagnosed.
|
|
2
|
Access the configuration screen by clicking on the Fault tab.
Result: The list of module anomalies appears:
|
