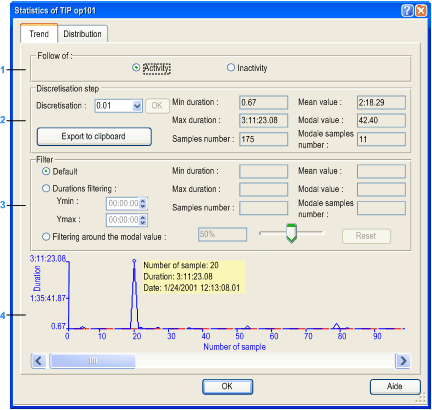
When you start analyzing the statistics of a variable, a new window appears. You are then able to perform different adjustments and view two types of graphic, i.e. Trend and Distribution, by clicking on the tabs.
You can perform different adjustments and close the window. Any time you reopen the statistics of the same variable, your adjustment settings will be restored, provided the .map file has not been closed.
NOTE: Whenever you define a production period in Trending Tool, it is included in the calculation of the statistics of the boolean variable.
1
Monitor allows you to calculate the statistics based on the variable's activity or inactivity, by clicking the appropriate radio button.
2
Discretisation step
3
Filter
4
Chart 