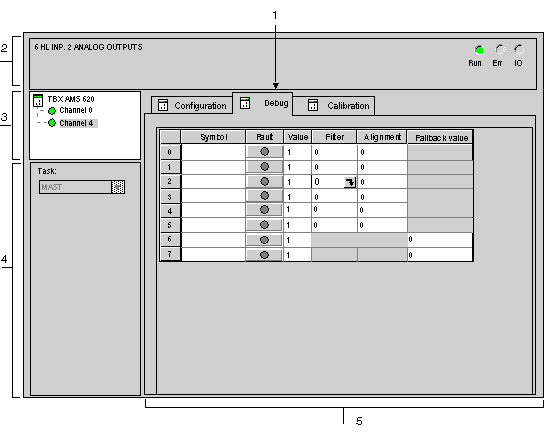
Description of the Debug screen of an Analog TBX Module
(Original Document)
At a Glance
The debug screen displays the value and state of each of the selected module's channels in real time.
Illustration
The figure below represents a debug screen.
Description
The following table shows the different elements of the debug screen and their functions.
Number
Element
Function
1
Tabs
The tab in the foreground indicates the mode in progress (Debug in this example). Each mode can be selected using the respective tab.
  • Debug which can be accessed only in online mode,
  • Calibration which can be accessed only in online mode,
  • Configuration.
2
Module area
Specifies the abbreviated heading of the module.
In the same area there are 3 LEDs which indicate the module’s operating mode:
  • RUN indicates the operating status of the module,
  • ERR indicates an internal fault in the module,
  • I/O indicates a fault from outside the module or an application fault.
3
Channel area
Is used:
  • By clicking on the reference number, to display the tabs:
    • Description which gives the characteristics of the device.
    • I/O Objects which is used to presymbolize the input/output objects.
    • Fault which shows the device faults (in online mode).
  • By clicking on the Channel, to select the channel or group of channels (maximum 4) to debug. To the left of the symbol there is a copy of the CHx channel LED.
4
General parameters area
Gives a reminder of the channel setting:
  • Task: specifies the MAST or FAST task configured. This heading is frozen.
5
Parameters in progress area
This area displays the state of the inputs and outputs, and the different parameters in progress.
For each of the channels, there is a maximum of six columns:
  • The Symbol column displays the symbol associated with the channel when it has been defined by the user (using the variable editor),
  • The Fault column creates direct access to the diagnostics for each channel when these are faulty (indicated by the indicator lamp built into the diagnostics access button, which turns red),
  • The Value column displays the status of each of the channels of the module,
  • The Filter column indicates the filtering value,
  • The Align column indicates the alignment value,
  • The Fallback Value column indicates the fallback value.