At a Glance
A power consumption budget is made for:
the rack power supply module,
each module (processor, input/output module) depending on the rack power supply module.
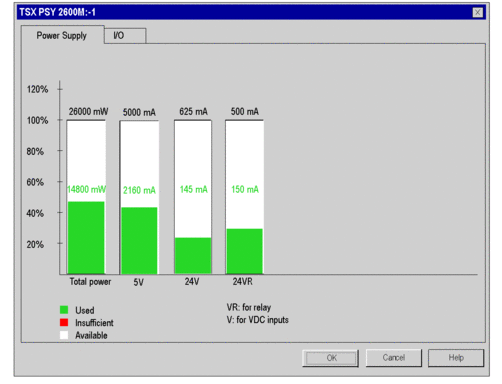
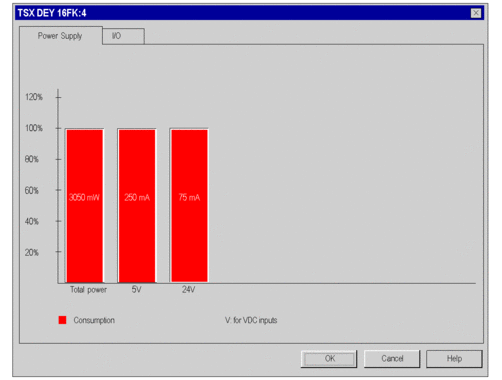
This budget is presented in the form of a bar chart where each color has a particular significance. For each voltage, it indicates:
the current power flow rate: green,
the quantity of power still available: white,
a power overload: red, when an excess occurs, a message is displayed.
the total power (same color code).
Power supply module budget
This consumption budget shows the amount of power discharged by the power supply for each voltage it supplies, as well as the total power.
When you add or remove a module, the budget is adjusted on opening the Power Supply and IO Budget window.
How to access a consumption budget:
Steps |
Action |
|---|---|
1 |
With the mouse, select the power supply module. |
2 |
Using the contextual menu, click Power Supply and IO Budget. The bar chart is displayed. |
3 |
Select the Power Supply tab. |
Budget:

Budget of the other modules
This consumption budget shows the amount of power discharged in the module for each voltage it uses, as well as the total power.
How to access a consumption budget:
Steps |
Action |
|---|---|
1 |
With the mouse, select the module of your choice. |
2 |
Using the contextual menu, click Power Supply and IO Budget. The bar chart is displayed. |
3 |
Select the Power Supply tab. |
Budget:


