At a Glance
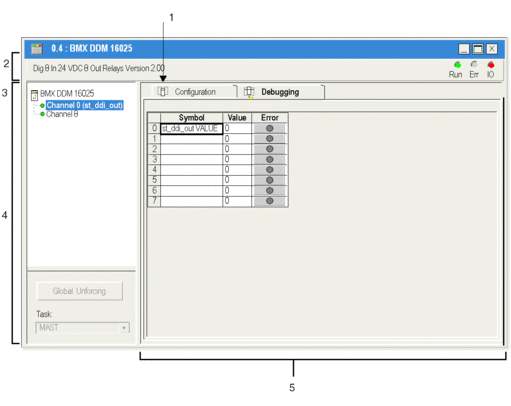
The debugging screen shows, in real time, the value and state of each channel of the selected module. It also allows access to the channel commands (forcing of the input or output value, reactivation of outputs, etc.).
Illustration
The figure below shows a sample debugging screen.

Description
The following table shows the various parts of the debugging screen and their functions.
Number |
Element |
Function |
|---|---|---|
1 |
Tabs |
The tab in the foreground indicates the mode in progress (Debug in this example). Every mode can be selected using the respective tab.
|
2 |
Module area |
Contains the abbreviated title of the module. In the same area there are 3 LEDs which indicate the module’s operating mode:
|
3 |
Channel area |
Allows you:
|
4 |
General parameters area |
Specifies the parameters of the channel:
|
5 |
Parameters in progress field |
This field displays the state of inputs and outputs and the various current parameters. For each channel, four items of information are available:
|


