Debugging a Specific Protocol Communication
(Original Document)
At a Glance
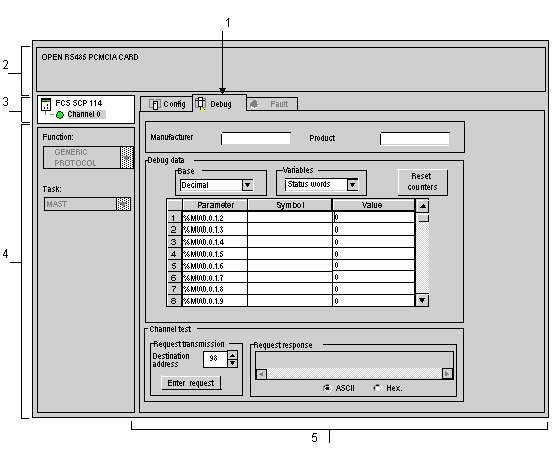
This screen, divided into several areas, is used to display the status and input/output %MWs, and send requests.
Illustration
The figure below shows an example of a debug screen for the Generic Protocol function.
Description
The table below shows the various elements of the debug screen and their functions.
Number
Element
Function
1
Tabs
The tab in the foreground indicates the mode in progress (Debug in this example). Each mode can be selected using the respective tab. The available modes are:
  • Debug: can be accessed only in online mode
  • Fault: can be accessed only in online mode
  • Configuration
2
Module area
Specifies the abbreviated heading of the module.
3
Channel area
Is used:
  • By clicking on the reference number, to display the tabs:
    • Description: gives the characteristics of the device
    • I/O Objects: used to presymbolize the input/output objects
    • Fault: shows the device faults (in online mode)
  • To select a channel
  • To display the Symbol, name of the channel defined by the user (using the variable editor)
4
General parameters area
Shows the communication channel parameters:
  • Function: Provides a reminder of the configured communication function. This heading is frozen.
  • Task: Shows the configured MAST task. This heading is frozen.
5
Viewing and control area
It is used to:
  • Select and display:
    • status words
    • input words
    • output words (modifiable)
  • Set the card counter to zero with the Reset Counters button.
  • Send requests from the protocol managed by the card, and display the responses according to an operating mode defined in the card documentation.