Debugging Fipio Agents
(Original Document)
At a Glance
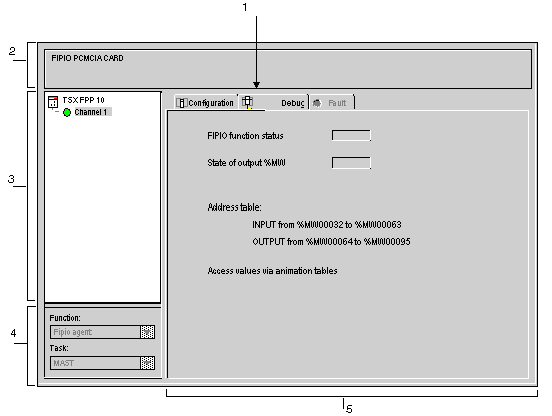
This screen, separated into two areas, allows you to debug a Fipio Agent.
Illustration
The figure below represents a debug screen.
Description
The following table shows the different elements of the debug screen and their functions.
Number
Element
Function
1
Tabs
The tab in the foreground indicates the mode in progress (Debug in this example). Each mode can be selected using the respective tab. The available modes are:
  • Debug which can be accessed only in online mode.
  • Fault (channel level) accessible only in online mode,
  • Configuration.
2
Module area
Gives a reminder of the device’s shortened name.
3
Channel area
Is used:
  • By clicking on the device reference number, to display the tabs:
    • Description which gives the characteristics of the device.
    • I/O Objects which is used to presymbolize the input/output objects.
    • Fault which shows the device faults (in online mode).
  • By clicking on the Channel, to select the channel to be debugged. To the left of the symbol there is a copy of the CHx channel LED.
4
General parameters area
This area displays the task (MAST or FAST) in which the channel's implicit exchange objects will be exchanged.
5
Debug area
Gives access to the debug parameters of a Fipio Agent.
No data can be accessed from this screen.