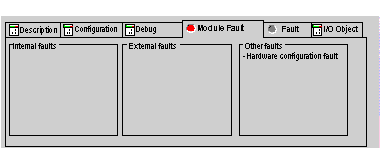
The functions of the module or channel diagnostics display the current errors which are classed according to their category:
-
internal errors (internal software errors, communication error with the processor, configuration, parametering or command error),
-
external errors (slave device failed, AS-i power supply switched off, terminal error, difference between physical configuration and Control Expert configuration),
-
Other errors (module missing or switched off).
A module or channel fault is indicated when certain LEDS change to red, such as:
-
In the Fipio bus screen, the presence of a red square at the connection point between the Fipio/AS-i gateway and the Fipio bus,
-
In all screens (the Description, Configuration, Debug, I/O Object, Module Fault and Fault tabs),
-
In the fault screen which can be accessed from the Module Fault screen where the module fault diagnostics are provided,
-
In the fault screen which can be accessed from the Module Fault screen where the channel fault diagnostics are provided.
The fault is also signaled:
-
On the module, on the central display,
-
By dedicated language objects: CH_ERROR (%I\2.e\r.m.c.ERR) and module error MOD_ERROR (%I\2.e\r.m.MOD.ERR), %MW\2.e\r.m.MOD.2, etc.
Procedure for Accessing the Module Diagnostics
The following table presents the procedure to access the Module diagnostics screen.
|
Step
|
Action
|
|
1
|
Open the TBX SAP 10 module on which you would like to perform diagnostics.
|
|
2
|
Click on the Module Fault tab.
Result: The list of module faults appears.
|
Procedure for Accessing the Channel Diagnostics
The following table presents the procedure for accessing the Channel diagnostics screen.
|
Step
|
Action
|
|
1
|
Open the TBX SAP 10 module on which you would like to perform diagnostics.
|
|
2
|
Click on the Fault tab.
Result: the list of channel faults appears.
|

