|
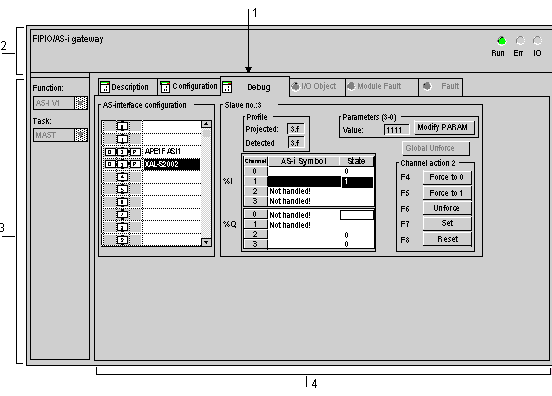
TBX SAP 10 Module Debug Screen
|
|


|
(Original Document)
|
|
TBX SAP 10 Module Debug Screen
|
|
|
(Original Document)
|
|
Number
|
Element
|
Function
|
|---|---|---|
|
1
|
Tabs
|
The tab in the foreground indicates the mode in progress (Debug in this example). Each mode can be selected using the respective tab. The available modes are:
|
|
2
|
Module area
|
Specifies the abbreviated heading of the module.
In the same area there are 3 LEDs which indicate the module’s operating mode
|
|
3
|
General parameters area
|
Shows the parameters of the MAST or FAST task configured for the AS-i communication channel.
|
|
4
|
AS-i and Slave Configuration area
|
Displays the slave devices connected to the bus.
Displays the status of the slave channels and gives access to the debug functions.
|
