|
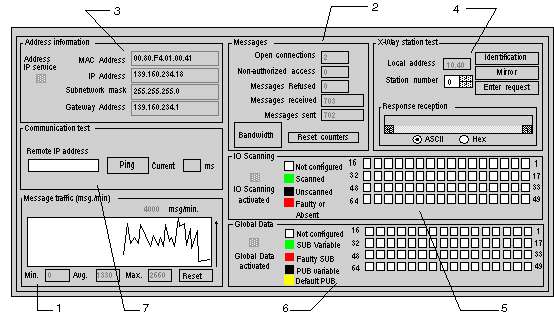
Module Debugging Screen
|
|
|
Original instructions
|

|
Number
|
Zone
|
Function
|
|---|---|---|
|
1
|
Message traffic
|
Allows the graphical display of the number of messages processed by the module
|
|
2
|
Messages
|
Allows you to view the number of connections and unacknowledged or rejected messages. The counter values can be reset using the Reset Counters button.
A Bandwidth button is used to access bandwidth diagnostics.
|
|
3
|
Address information
|
Allows:
|
|
4
|
X-Way station test
|
Allows UNI-TE communication testing on the TCP/IP profile
|
|
5
|
IO Scanning
|
Allows display of the status for each remote input/output module
|
|
6
|
Global Data
|
Allows display of the status for Global Data variables
|
|
7
|
Communication test
|
Performs a communication test
|