|
Accessing the Ethernet Module’s Diagnostic Capabilities
|
|
|
Original instructions
|
|
Step
|
Action
|
|---|---|
|
1
|
Perform the steps using a Unitelway Link.
|
|
2
|
Select PLC → Connect on the Control Expert screen.
|
|
3
|
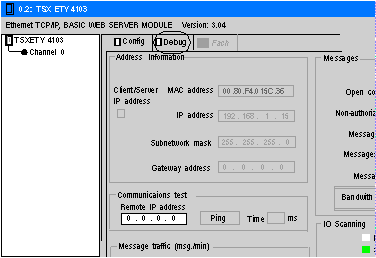
In the Project Browser, double-click TSX ETY 4103 under Station → Configuration → XBus.
|
|
4
|
Select the Debug tab to display the debug screen.
 |
|
Step
|
Action
|
|---|---|
|
1
|
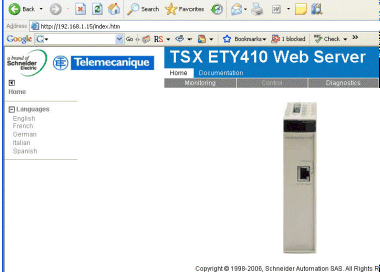
At the PC, start a Web browser such as Internet Explorer.
|
|
2
|
Enter the TSX ETY 4103’s currently assigned IP address in the Address field of the browser to bring up the module’s home page.
 |
|
3
|
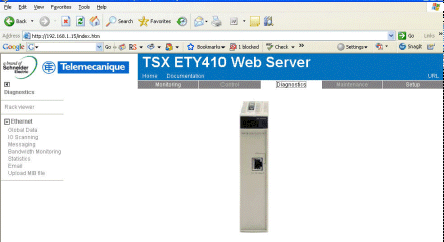
Click the Diagnostics tab.
|
|
4
|
Enter a user name and password. (The default is USER for both.)
NOTE: Check with your system administrator to see if the user name and password have been changed. |
|
5
|
Click OK to bring up the ETY’s diagnostic web page.
 |
|
6
|
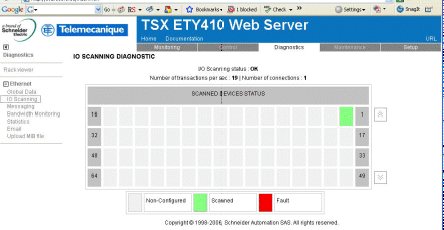
Click the I/O Scanning link on the left-hand side of the screen to access the I/O scanning diagnostics web page.
 |