|
|
(Original Document)
|

|
Number
|
Element
|
Function
|
|---|---|---|
|
1
|
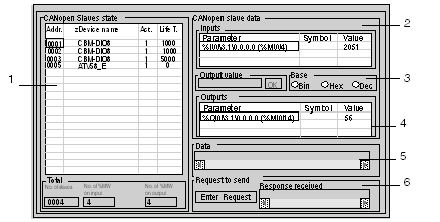
CANopen slave status
|
This zone displays all the CANopen bus slaves. A faulty slave is displayed in red; when this fault disappears, it is displayed in blue. Otherwise, it is displayed in black. Selecting a slave updates zones 2, 4 and 5.
Act. : indicates whether the slave was activated in the Sycon configuration (1=activated, 0=deactivated)
Life T.: Life Time.
|
|
2
|
Inputs
|
When a slave is selected, this zone contains the list of words, which are associated with it on input.
A clearer explanation is given with the display of the CANopen topological address (%IW\3.1\0.0.0.0) and reserved memory area in the PLC (%MW4).
|
|
3
|
Output value
|
When an output word in zone 4 is selected, its value can be modified by entering a new value then clicking on the OK button.
|
|
4
|
Outputs
|
When a slave is selected, this zone contains the list of words, which are associated with it on output.
A clearer explanation is given with the display of the CANopen topological address (%QW\3.1\0.0.0.0) and reserved memory area in the PLC (%MW14).
|
|
5
|
Information on
|
When a slave is selected (click in zone 1), this zone contains its last diagnostic message, and to obtain information on the TSX CPP 110 card simply click on the table header.
|
|
6
|
Request to send
|
This zone is used to send a SDO request. Parameter syntax is identical to that used to transfer SDOs using READ_VAR and WRITE_VAR requests. Pressing the Enter Request button makes the request input fields appear.
|