

Overview
System monitoring lets you know whether devices of a system project that appear in a physical view are active by using a diagnostic engine. The engine sends requests to the IP address of each device and monitors responses.
The communication status of a device, PAC, or module is indicated by a diagnostic icon in the physical view. You can add, modify, and remove objects while system monitoring is active. The status is indicated or refreshed automatically.
Status Detection Method
Unless mentioned otherwise, the diagnostic engine that runs on the computer acting as Control Expert server sends ping requests to the IP address that is configured for the of the device and monitors responses.
For modules of M580 PACs, the following IP addresses are used:
Standalone PACs:
Redundant PACs: and
Prerequisites
The following are prerequisites for using system monitoring with devices:
The devices have been added to a physical view.
The system server can communicate with the devices.
For generic automation devices, you have enabled diagnostics.
The SODB service is running.
The firewall is configured to allow communication between the computer acting as Control Expert server and devices by using port 502.
Connecting to the Diagnostic Engine
For a given Control Expert client/server infrastructure, the first Topology Manager instance to activate system monitoring connects to the diagnostic engine. System monitoring is readily available for any other Control Expert instance that is connected to this system server.
To start using system monitoring, proceed as follows.
Step |
Action |
|---|---|
1 |
Open the system project. |
2 |
Click the button in the toolbar. Result: The button appears selected, is displayed in the tab, and diagnosis starts. The communication status is indicated on devices that appear in a physical view. |
Disconnecting the Diagnostic Engine
For a given Control Expert client/server infrastructure, once the diagnostic engine is ready, it remains available until the last Control Expert instance that is connected to this system server deactivates system monitoring from its Topology Manager.
When you close a system project, the Topology Manager, or if the connection to the system server is interrupted, the diagnostic engine is stopped.
To stop using system monitoring, proceed as follows.
Step |
Action |
|---|---|
1 |
Click the button in the toolbar. Result: Diagnosis stops and the communication status is not indicated on devices anymore. NOTE: When
the last Topology Manager instance to use the diagnostic engine in a given Control Expert infrastructure deactivates system monitoring, is
displayed in the tab.
|
Impact of Device Configuration on System Monitoring
The table indicates the impact of the configuration of devices on the diagnostic information.
Configuration |
Result |
|---|---|
No IP address for the embedded interface is configured (independently of the configuration of the attribute). |
Only the service not available icon is shown.
(Gray dot) |
An IP address for the embedded interface is configured but the logical network attribute is set to . |
Diagnostic information is available normally. |
The attribute is set to true (selected). |
The device does not show diagnostic information. NOTE: This applies also to modules that
inherit their under construction status from the parent device.
|
The attribute of the PAC is set to . |
The diagnostic information shown applies to the physical device based on its IP address and not to the simulator. |

Statuses Indicated by Diagnostic Icons
The table describes the meaning of the icons that appear on devices displayed in a physical view. Their description is indicated in a tooltip.
Icon |
Description |
Device status |
|---|---|---|
|
Service being started or not available (gray dot). |
Diagnostic information is not valid. This can be caused by a non-operational diagnostic engine. Default icon for devices and modules whose IP address for the embedded interface is not configured. |
|
Not reachable (red dot with black cross). |
The device is not reachable or did not respond to the request. |
No icon appears. |
The device responded successfully to the request. If several requests were sent by using different protocols (for example, ping and SNMP), the device responded to at least one of them. |
|

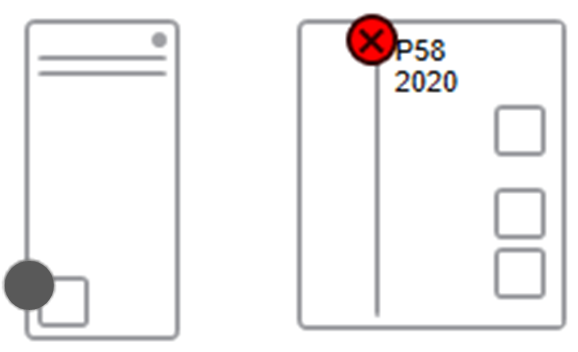
Representation of the Communication Status
The following figure shows an example of a server station and an M580 CPU module displaying diagnostic icons.
Representation of the Communication Status for Devices Containing Modules
Depending on the zoom level that is applied in a physical view, the diagnostic icons for devices that contain modules are shown as follows.
100% and higher: The icon is shown on each module.
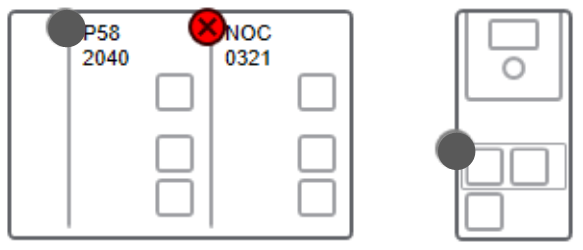
Less than 100%: A global diagnostic icon is shown at the local rack or device level.
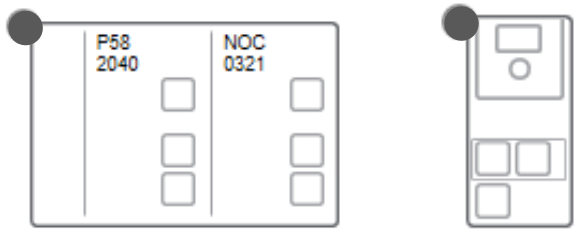
The table describes the resulting global diagnostic icon based on the icon of each module.
Icon of individual modules |
Resulting global icon for rack or device |
|---|---|
No icon for all modules of the device. |
None |
|
Gray dot. Service being started or not available |
|
Red dot with black cross. Not reachable |
Troubleshooting
If you experience difficulties obtaining diagnostic information, verify that the SE SODB ControlExpert Host X service (where X represents the version) of the Service Oriented Device Bus (SODB) diagnostic engine is running on the system server computer ( window of the Windows® operating system). If not, start it and enable system monitoring again.