General Debugging Parameters
Original instructions
Introduction
Double-click the module to open the debug tab.
The general debugging parameters on the module debugging screen are grouped into two windows:
Message Traffic
The Message traffic window looks like this:
It graphically shows the number of Ethernet packets per second handled by the module (sent and received).
The Reset button resets the Min., Av., and Max counters to 0.
Messages
The Messages window looks like this:
This window reports the number of:
This window includes three buttons:
Ping
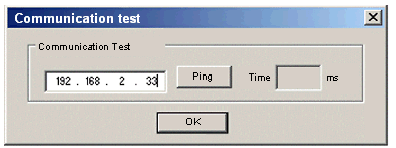
You can test the routing between your module and another device through a PING request:
Step
Action
Comment
1
Enter the IP address of the device for which you want to test communications and press Ping.
2
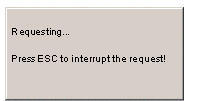
Wait for the request to be processed
This window appears:
3
The COMMUNICATION window informs you that the exchange was successful.
The COMMUNICATION window:
4
Press OK.
With the successful PING request, a value appears in the ms field.
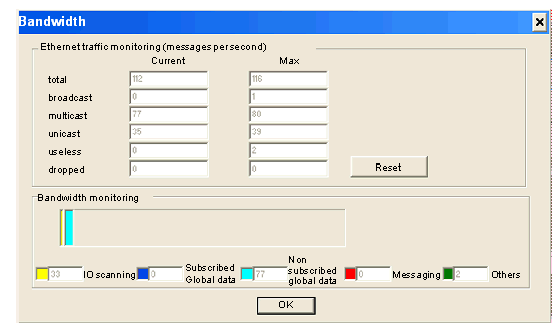
Bandwidth
Press the Bandwidth button to see the number of messages received per second in the Bandwidth window. Available bandwidth and network load are reported in terms of dynamic bandwidth monitoring.
NOTE: Press Reset to clear the Max column fields.