Back to Performance Indicators
(Original Document)
This section contains general information about the assessment of an automated installation. You will find an example of the distribution of operating times (known as status times) as well as topics covering how to create performance indicators.
Measuring Performance
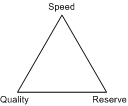
The performance of an installation or piece of equipment depends on three specific factors: trend, quality, and operational availability.
These factors must be compared with the nominal values agreed with the machine's manufacturer to assess the installation's overall output.
Status Times
The total running time of an automated installation can be broken down into a succession of periods called statuses. Analyzing the status times of an installation provides useful information about how the installation is running, and well though-out and efficient solutions can therefore be applied to improve the systems. There are several possible breakdowns of the status times by jobs and experiences. Below is a breakdown based on the CNOMO E41150520N standard.
Total time
Required time
Running
Good running
Good parts production
Bad parts production
Others
Corrupt running
Good parts production
Bad parts production
Others
Proper stop
Failure
Undetected failure
Awaiting maintenance
Diagnostic
Tool supply
Spare parts supply
Repair = corrective maintenance action
Return to service
Others
Functional stop
Scheduled tool change
Manufacturing change
Control
Regular servicing
Others
Induced stop
Saturation
Lack of parts
Lack of operator
Lack of energy
Non-standard upstream parts
Others
Non-required time
Break
Systematic servicing
Conditional servicing
Unused
Others
This table below can also be explained using the following definitions:
Total time
Reference period covering all the possible resource statuses (24 hours, week, month, etc.
Required time
Time during which the user applies resources for production purposes.
Running time
Time during which the resources perform the function in accordance with the specifications.
Downtime
Period of time during which the resources cannot perform their function following a failure (random part of the proper stop time). A failure is a fault in an element of the resources preventing the latter from performing their function.
Functional stop time
The functional stop time covers the scheduled part of the proper stop time (scheduled tool change time, manufacturing change time, regular servicing time, etc.)
Induced stop time
Period of required time during which the resources cannot perform their function for external reasons.
Proper stop time
Period of required time during which the resources cannot perform their function for a reason related to the resources themselves.
The Role of Trending Tool
By analyzing the signals recorded by Trending Tool on your installation, you will be able to set up calculated variables that represent the different status times of your installation. The statistical data table linked to each of these variables (whether the signal comes directly from the machine or whether it is a composite signal calculated by Trending Tool) provides all the relevant information such as the activation time of each variable and the average activation time. For example, if you set up an indicator representing the running time, Trending Tool immediately calculates the average time for each run and the total running time for the recording period. You can precisely analyze this indicator by breaking down the data by production periods that represent a shift or a manufacturing batch. Moreover, comparing seasonal recordings (one per month, one per week, etc.) will also enable you to monitor your installation's development trend and measure your installation's growth in productivity.
In Trending Tool, the calculated variable concept is the basis of all the performance measurement actions you will be able to perform. The following chapters feature additional information on Trending Tool functions: