At a Glance
Tracing task execution consists of knowing at a given moment (breakpoint reached, step by step mode in progress) what the task execution path is, that is to say, what subroutines (SR), user function blocks (DFB) have been called and what the nesting level is.
For this purpose, a tool is available for your use: the LIFO stack (Last In First Out) which memorizes all nestings so that you can monitor task execution.
How to Access a Program Element from the Stack
Carry out the following actions:
Step |
Action |
|---|---|
1 |
From a breakpoint or a step-by-step mode in progress either by:
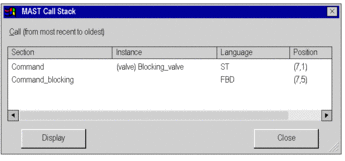
Example: Command_blocking section having called a Blocking_valve (valve type) DFB instance in the Command section:  The line number is used for Structured Text and Instruction List editors; for Ladder and FBD editors, this is the number of the rung or the block that is displayed. |
2 |
If you select:
|
Clicking the Close button closes the window representing the stack: the green triangle disappears following:
the resumption of step by step,
a new call to display the contents of the stack,
a restart of the task
 .
.


 button in the debug toolbar.
 ,
, .
.