Introduction
The following pages provide actions to perform when:
SOE page is empty
SOE page displays old events with recent events not shown
SOE Page Is Empty
Possible cause for an empty SOE page (non-exhaustive):
The system is not able to get events or there are no events in the system.
Example of use cases which may lead to an empty SOE page:
The alarm server is busy and cannot answer the request in the given time.
The client display is not connected to the alarm server.
The client user does not have the privileges to see the existing events.
Actions to perform:
Step |
Action |
|---|---|
1 |
Check that information is displayed in the active alarm page. If the active alarm page is:
|
2 |
Check in the hardware alarms and verify that your client is connected to the alarm server (a detected error is displayed when the alarm server is not connected). |
3 |
Verify that you did not deactivate
the cluster for this client. More details on |
4 |
Verify that you are logged in with the appropriate level of privileges. |
5 |
Check that no filter is applied, filtering can generate an empty recordset. |
6 |
Try to decrease the requested range by using the filter capability (use filter to request events for the last hour or for a particular tag for example). |
7 |
Try to increase the request time-out for all alarm servers or for a particular alarm server:
More details on |
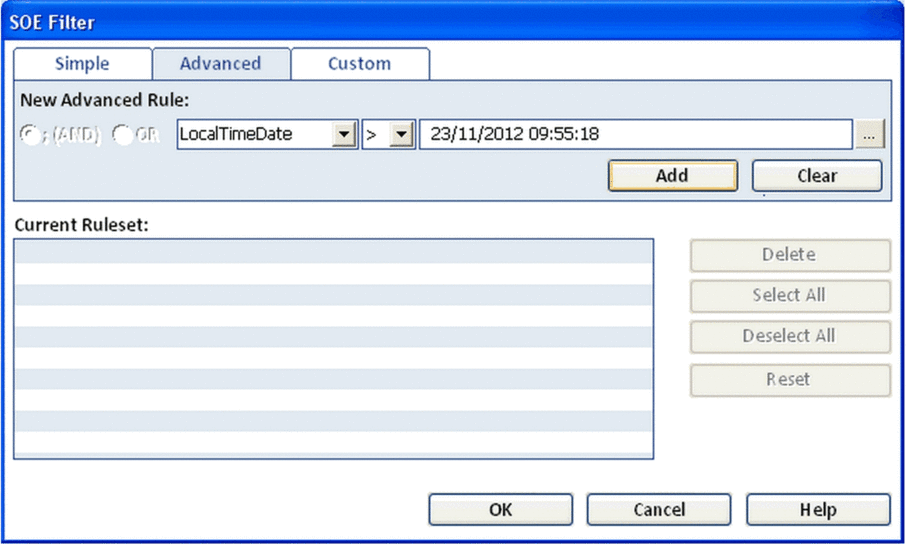
Example of SOE display filter in AVEVA Plant SCADA:

SOE Page Displays Old Events While Recent Events Are Not Shown
Possible cause for old events to be displayed in the SOE page (non-exhaustive):
The SOE page is not automatically refreshed.
Example of situations when this situation can occur:
The refresh is done on request and the current page displayed can be old.
The system may not be able to manage the refresh request.
The device time is delayed compared to the current local time (after conversion by the client). In such a case, the TS events may appear at the bottom of the SOE page queue. If other events in the page are based on the current local time, those events fill-up the SOE page and give the impression that TS events are missing.
Actions to perform:
Step |
Action |
|---|---|
1 |
Reload the page to check if the display needed a refresh. |
2 |
Check that a filter selecting only old records is not applied. |
3 |
Try to decrease the requested range by using the filter capability (use filter to request events for the last hour or for a particular tag for example). |
4 |
Try to increase the system capabilities to manage large number of events:
More details on |
Example of INI file:
[alarm]
       CacheSize = 80
       QueryRowLimit = 1000000
       ClientRequestTimeout = 300000
Parameters Definitions in AVEVA Plant SCADA
ClientRequestTimeout:
Definition: this parameter defines the amount of time, in milliseconds, in which the client can request data from a server. If the server has not responded by the end of this time, the request has been unsuccessful.
Allowable values: 0 to 4294967295
Default value: 120000
CacheSize:
Definition: this parameter defines the amount of memory (in megabytes) dedicated to the storage of event data. For many systems, the default setting of 25 MB is appropriate. However, if your system is experiencing difficulties with server performance and the cache size needs to be adjusted, you can alter the cache size settings as required.
Allowable values: 0 to 400
Default value: 25
QueryRowLimit:
Definition: defines the maximum number of rows that can be returned in the result set for a single query. Increasing the
QueryRowLimitmay affect performance.Allowable values: 0 to 4294967295
Default value: 200000


