|
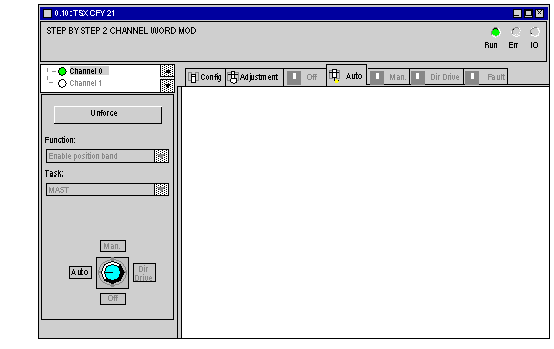
Description of the debug screens
|
|
|
(Original Document)
|

|
Light
|
State
|
Meaning
|
|---|---|---|
|
RUN
|
On
|
Module is operating
|
|
ERR
|
On
Flashing
|
Module is out of service
Communication error with the processor
|
|
IO
|
On
|
Process error (AX_FLT %Ir.m.c.2 bit)
Module failed. In choosing the Default tab associated with this button, a diagnostics window appears in order to clarify the source of the error (See Diagnostics and maintenance).
|
|
Command
|
Function
|
|---|---|
 |
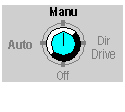
Button to select the operating mode
If you want to change the operating mode, click on the name of the new mode to be selected (or click as many times as necessary on the button).
Using the keyboard, select the button using the Tab key then press as many times as necessary on the Space bar.
You can also access the operating modes via the View menu.
When the selected mode is actually recognized by the module, the monitoring zone for movements in the selected mode is displayed.
Caution: although selected, it is possible for the selected mode not to be recognized by the module channel (for example, if the PLC is in STOP mode).
|
 |
The unforcing button enables global unforcing of all forced objects.
|