Introduction
The SIL value evaluates the robustness of an application against failures, thus indicating the ability of a system to perform a Safety Function within a defined probability. The IEC 61508 specifies 4 levels of Safety performance depending on the risk or impacts caused by the process for which the Safety-Related System is used. The more dangerous the possible impacts are on community and environment, the higher the Safety requirements are to lower the risk.
SIL Value Description
Discrete level (1 out of a possible 4) for specifying the Safety Integrity requirements of the Safety Functions to be allocated to the Safety-Related Systems, where Safety Integrity Level 4 has the highest level of Safety Integrity and Safety Integrity Level 1 has the lowest, see SILs for Low Demand.
SIL Requirements Description
To achieve Functional Safety, 2 types of requirements are necessary:
Safety Function requirements, defining what Safety Functions have to be performed
Safety Integrity requirements, defining what degree of certainty is necessary that the Safety Functions are performed
The Safety Function requirements are derived from hazard analysis and the Safety Integrity ones from risk assessment.
They consist of the following quantities:
Mean time between failures
Probabilities of failure
Failure rates
Diagnostic coverage
Safe failure fraction
Hardware fault tolerance
Depending on the level of Safety Integrity, these quantities must range between defined limits.
SIL Rating Description
As defined in the IEC 61508, the SIL value is limited by both the Safe Failure Fraction (SFF) and the hardware fault tolerance (HFT) of the subsystem that performs the Safety Function. A HFT of n means that n+1 faults could cause a loss of the Safety Function, the Safe state cannot be entered. The SFF depends on failure rates and diagnostic coverage.
The following table shows the relation between SFF, HFT, and SIL for complex Safety-Related subsystems according to IEC 61508-2, in which the failure modes of all components cannot be completely defined:
SFF |
HFT=0 |
HFT=1 |
HFT=2 |
|---|---|---|---|
SFF ≤ 60% |
- |
SIL1 |
SIL2 |
60% < SFF ≤ 90% |
SIL1 |
SIL2 |
SIL3 |
90% < SFF ≤ 99% |
SIL2 |
SIL3 |
SIL4 |
SFF > 99% |
SIL3 |
SIL4 |
SIL4 |
There are 2 ways to reach a certain Safety Integrity Level:
via increasing the HFT by providing additional independent shutdown paths
via increasing the SFF by additional diagnostics
SIL-Demand Relation Description
The IEC 61508 distinguishes between low demand mode and high demand (or continuous) mode of operation.
In low demand mode, the frequency of demand for operation made on a Safety-Related System is not greater than 1 per year and not greater than twice the proof test frequency. The SIL value for a low demand Safety-Related System is related directly to its average probability of failure to perform its Safety Function on demand or, simply, probability of failure on demand (PFD).
In high demand or continuous mode, the frequency of demand for operation made on a Safety-Related System is greater than 1 per year and greater than twice the proof test frequency. The SIL value for a high demand Safety-Related System is related directly to its probability of a dangerous failure occurring per hour or, simply, probability of failure per hour (PFH).
SILs for Low Demand
The following table lists the requirements for a system in low demand mode of operation:
Safety Integrity Level |
Probability of Failure on Demand |
|---|---|
4 |
≥ 10-5 to < 10-4 |
3 |
≥ 10-4 to < 10-3 |
2 |
≥ 10-3 to < 10-2 |
1 |
≥ 10-2 to < 10-1 |
SILs for High Demand
The following table lists the requirements for a system in high demand mode of operation:
Safety Integrity Level |
Probability of Failure per Hour |
|---|---|
4 |
≥ 10-9 to < 10-8 |
3 |
≥ 10-8 to < 10-7 |
2 |
≥ 10-7 to < 10-6 |
1 |
≥ 10-6 to < 10-5 |
For SIL3, the required probabilities of failure for the complete Safety integrated system are:
PFD ≥ 10-4 to < 10-3 for low demand
PFH ≥ 10-8 to < 10-7 for high demand
Safety Loop Description
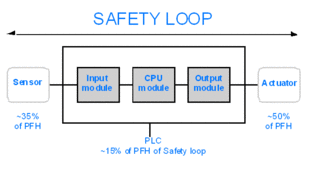
The Safety loop to which the M580 Safety PAC consists of the following 3 parts:
Sensors
M580 Safety PAC with safety power supply, safety CPU, safety Coprocessor, and safety I/O modules
Actuators
A backplane or a remote connection that includes a switch or a CRA does not destroy a Safety Loop. Backplanes, switches, and CRA modules are part of a the black channel. This means that the data exchanged by I/O and PAC cannot be corrupted without detection by the receiver.
The following figure shows a typical Safety loop:

As shown in the figure above, the contribution of the PAC is only 10-20% because the probability of failure of sensors and actuators is usually quite high.
A conservative assumption of 10% for the Safety PAC’s contribution to the overall probability leaves more margin for the user and results in the following required probabilities of failure for the Safety PAC:
PFD ≥ 10-5 to < 10-4 for low demand
PFH ≥ 10-9 to < 10-8 for high demand
PFD Equation Description
The IEC 61508 assumes that half of the failures end in a Safe state. Therefore, the failure rate λ is divided into
λS - the safe failure and
λD - the dangerous failure, itself composed of
λDD - dangerous failure detected by the internal diagnostic
λDU - dangerous failure undetected.
The failure rate can be calculated by using the mean time between failures (MTBF), a module specific value, as follows:
λ = 1/MTBF
The equation for calculating the probability of failure on demand is:
PFD(t) = λDU x t
t represents the time between 2 proof tests.
The probability of failure per hour implies a time interval of 1 hour. Therefore, the PFD equation is reduced to the following one:
PFH = λDU


