Overview
The following unconnected explicit messaging example
shows you how to use the MBP_MSTR function block to retrieve diagnostic information for an STB island from an STB NIC
2212 network interface module, by using the Get_Attributes_Single
service.
You can perform the same explicit messaging service using the EtherNet/IP Explicit Message Window of the Control Expert Ethernet Configuration Tool.
Implementing the MBP_MSTR Function Block
To implement the MBP_MSTR function block, you need to create and assign variables, then connect
it to an AND block. In the following example, the
logic will continuously send an explicit message upon receiving notice
of success:

Input Variables
Variables need to be created and assigned to input pins. For the purpose of this example, variables have been created — and named — as described below. (You can use different variable names in your explicit messaging configurations.)
Input Pin |
Variable |
Data Type |
|---|---|---|
|
Enable |
|
|
StopEM |
|
Output Variables
Variables also need to be created and assigned to output pins. (The names assigned to output variables apply only to this example, and can be changed in your explicit messaging configurations.)
Output Pin |
Variable |
Data Type |
|---|---|---|
|
EMActive |
|
|
EMError |
|
|
EMSuccess |
|
|
EIP_ControlBuf |
Array of 10 |
|
EIP_DataBuf |
Array of 100 |
CONTROL and DATABUF output pins to a byte array consisting
of located variables. When configured in this manner, you will not
need to be aware of the location of data within a word (for example,
high versus low byte, and big or little endian format).Control Array
The control
array parameter (EIP_ControlBuf) consists of 9 contiguous words. You need to configure only some
control words; other control words are read-only and are written to
by the operation. In this example, the control array defines the operation
as an unconnected explicit message, and identifies the target device:
Register |
Description |
Configure |
Setting (hex) |
|---|---|---|---|
|
Operation: High byte =
Low byte = 0E (CIP explicit message) |
Yes |
16#000E (unconnected) |
|
Detected error status: read-only (written by operation) |
No |
16#0000 |
|
Data buffer length = 100 words |
Yes |
16#0064 |
|
Response offset: offset — in words — for the beginning of the explicit message response in the databuffer |
Yes |
16#0004 |
|
High byte = slot location of the communication module in the backplane Low byte = 0 (not used) |
Yes |
16#0400 |
|
IP address of the Ethernet communication module: High byte = byte 4 of the IP address Low byte = byte 3 of the IP address |
Yes |
16#C0A8 |
|
IP address of the Ethernet communication module: High byte = byte 2 of the IP address Low byte = byte 1 of the IP address |
Yes |
16#0106 |
|
CIP request length (in bytes) |
Yes |
16#0008 |
|
Length of received response (written by operation) |
No |
16#0000 |
1. In this example, the control parameter handles the IP address 192.168.1.6 in the following order: Byte 4 = 192, Byte 3 = 168, Byte 2 = 1, Byte 1 - 6. |
|||
CIP Request
The CIP request is located at the beginning of the databuffer and is followed by the CIP response. In this example, the CIP request calls for the return of a single attribute value (diagnostic data), and describes the request path through the target device’s object structure leading to the target attribute:
Request word |
High byte |
Low byte |
||
|---|---|---|---|---|
Description |
Value (hex) |
Description |
Value (hex) |
|
1 |
Request path size (in words) |
16#03 |
EM Service: Get_Attributes_Single |
16#0E |
2 |
Request path: class assembly object |
16#04 |
Request path: logical class segment |
16#20 |
3 |
Request path: instance |
16#64 |
Request path: logical instance segment |
16#24 |
4 |
Request path: attribute |
16#03 |
Request path: logical attribute segment |
16#30 |
Combining the high and low bytes, above, the CIP request would look like this:
Request word |
Value |
|---|---|
1 |
16#030E |
2 |
16#0420 |
3 |
16#6424 |
4 |
16#0330 |
Viewing the Response
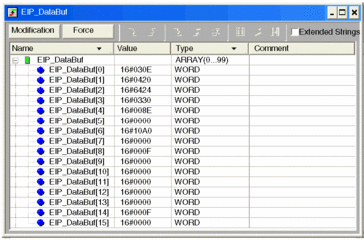
Use a Control Expert Animation table to display the EIP_DataBuf variable array. Note that the EIP_DataBuf variable array consists of the entire data buffer, which includes the:
CIP request (4 words) located in EIP_DataBuf(1-4)
CIP service type (1 word) located in EIP_DataBuf(5)
CIP request status (1 word) located in EIP_DataBuf(6)
CIP response (in this case, 10 words) located in EIP_DataBuf(7-16)
To display the CIP response, follow these steps:
Step |
Action |
|
|---|---|---|
1 |
In Control Expert, select Tools → Project Browser to open the . |
|
2 |
In the , right-click . Result: A new animation table opens. |
|
3 |
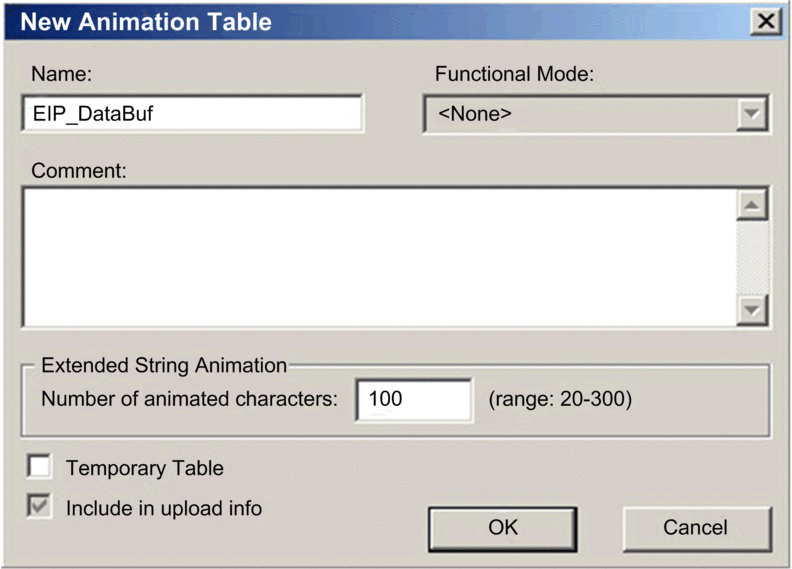
In the dialog, edit the following values: |
|
Name |
Type in a table name. For this example: EIP_DataBuf. |
|
Functional Mode |
Accept the default <None>. |
|
Comment |
Leave blank. |
|
Number of animated characters |
Type 100, representing the size of the data buffer in words. |
|
4 |
The completed dialog looks like this:  Click to close the dialog. |
|
5 |
In the animation table’s column, type in the name of the variable assigned to the databuffer: EIP_DataBuf and press Enter. The animation table displays the EIP_DataBuf variable. |
|
6 |
Expand the EIP_DataBuf variable to display its word array, where you can view the CIP response at words EIP_DataBuf(7-16):  Note: Each word presents 2 bytes of data in little endian format, where the least significant byte is stored in the smallest memory address. For example, ‘0E’ in EIP_DataBuf[0] is the low byte, and ‘03’ is the high byte. |
|


