I/O Scanner Response Times: Remote Input to Remote Output
Original instructions
Measurement Setup
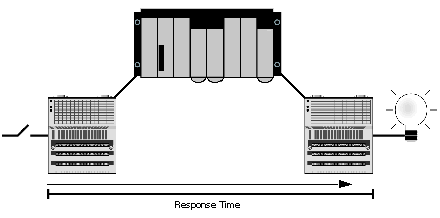
The set of curves below illustrates Quantum PLC response times when a signal is sent from a remote input module to a remote output module through a Quantum PLC:
The signal is:
1 triggered by a Momentum input module with a response time of ~2 ms 2 scanned into the Quantum PLC at a repetitive rate of 0 ms 3 copied to another internal variable within the PLC 4 written to a Momentum output module with a response time of ~2 ms
140 CPU 434 12A with 140 NOE 771 x1 Module
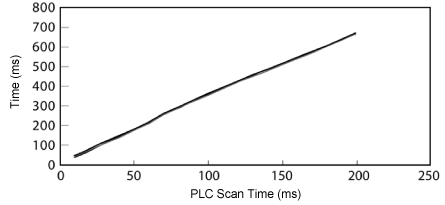
The 140 CPU 434 12A with an NOE 771 x1 (v3.3) was used for the following measurements:
The plot shows four lines representing the number of scanned devices:
The four lines are indistinguishable at this scale because the response times are so similar. You can see the similarity in the following table of data from which the above graph was plotted:
Number of Devices to Scan
Time from Scanned Device Input to Scanned Device Output (ms)
434 12A + NOE 771 x1 (v3.3)
10 ms scan
20 ms scan
50 ms scan
100 ms scan
200 ms scan
1 device
41
73
179
358
665
8 devices
42
75
180
360
666
16 devices
44
77
182
361
668
32 devices
46
79
185
364
671
140 CPU 65 150 with NOE 771 x1 (v3.3)
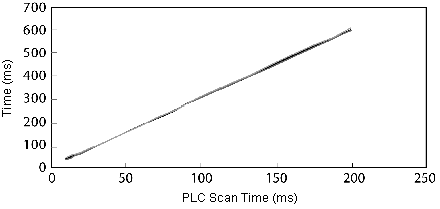
The 140 CPU 65 150 with an NOE 771 x1 (v3.3) is used used for the following measurements:
The plot shows four lines representing the number of scanned devices:
The four lines are indistinguishable at this scale because the response times are so similar. You can see the similarity in the following table of data from which the above graph was plotted:
Number of Devices to Scan
Time from Scanned Device Input to Scanned Device Output (ms)
65150 + NOE 771x1 (v3.3)
10 ms scan
20 ms scan
50 ms scan
100 ms scan
200 ms scan
1 device
35
61
153
302
602
8 devices
36
62
154
303
603
16 devices
38
64
155
305
606
32 devices
40
66
157
307
609