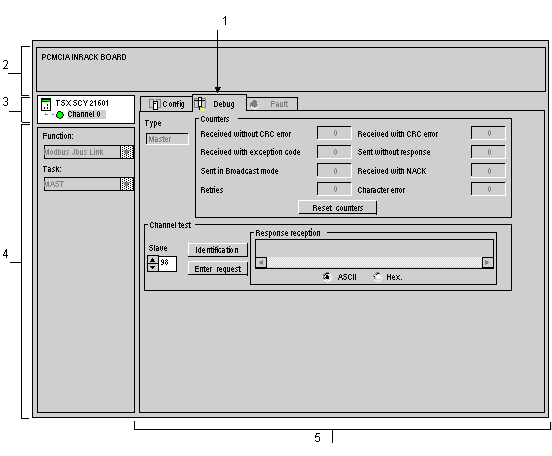
Modbus Debugging Screen
(Original Document)
At a Glance
This screen, which is split into various zones, is used to choose the communication channel and to access the debugging parameters for a Modbus link.
Illustration
The figure below shows a sample Modbus communication debugging screen.
Description
The table below shows the various elements of the debugging screen and their functions.
Address
Element
Function
1
Tabs
The front tab shows the current mode (Debugging in this example). Each mode can be selected by the corresponding tab. The modes available are:
  • Debugging: accessible only in online mode
  • Diagnostics: accessible only in online mode
  • Configuration
2
Module zone
Specifies the shortened name of the module.
3
Channel field
Is used:
  • By clicking on the reference number, to display the tabs:
    • Description: gives the characteristics of the device
    • I/O Objects: used to presymbolize the input/output objects
    • Fault: shows the device faults (in online mode)
  • to select the channel
  • to display the Symbol, the name of the channel defined by the user (using the variable editor)
4
General parameters zone
Shows the communication channel parameters:
  • Function: Shows the configured communication function. This information cannot be modified.
  • Task: Shows the configured MAST task. This information cannot be modified.
5
Display and command zone
Used to access a Modbus link’s debugging parameters.
It is different according to the type of Modbus function which is configured:
  • Modbus master
  • Modbus slave
NOTE: LEDs and commands not available appear grayed out.