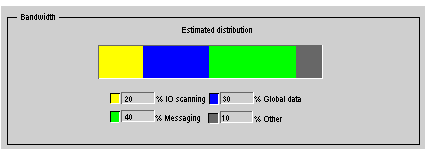
When bandwidth control is activated, the load of the coprocessor is displayed on the screen:
This graphic displays the actual load distribution, between I/O scanning, Global Data, Messaging and other services:
-
%IO Scanning: yellow
-
% Global Data: blue
-
% Messaging: green
-
% Other: gray
