|
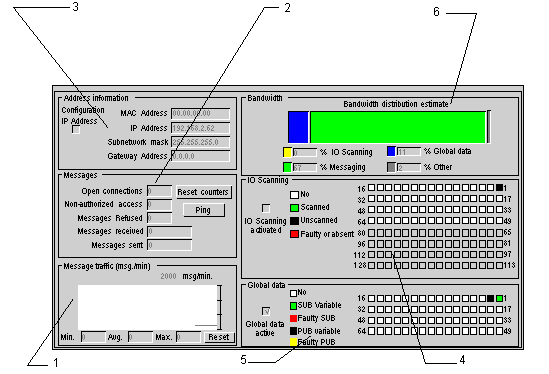
Ethernet Channel Debugging Screen
|
|
|
Original instructions
|

|
Number
|
Zone
|
Function
|
|---|---|---|
|
1
|
Message traffic
|
Allows the graphical display of the number of messages processed by the module
|
|
2
|
Messages
|
Allows the display of the number of unacknowledged or refused messages and connections. The counter values can be reinitialized using the Init Counters button.
A Ping button is used to access the communication test.
|
|
3
|
Addresses
|
Displays the various TCP/IP addresses
|
|
4
|
IO Scanning
|
Allows display of the status for each remote input/output module
|
|
5
|
Global Data
|
Allows display of the status for Global Data variables
|
|
6
|
Bandwidth
|
Displays the Bandwidth diagnostics
|