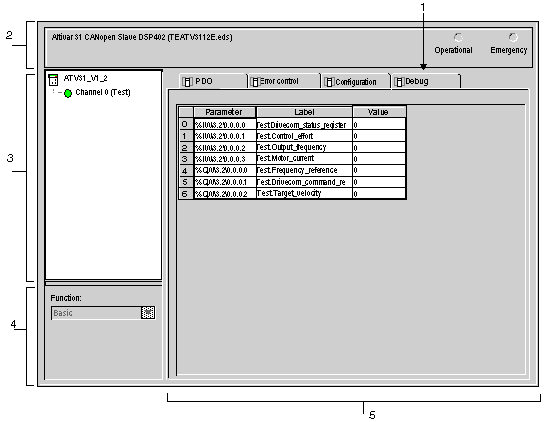
This screen can only be used in online mode.
The figure below shows a slave debug screen:
Description of the Debug Screen for Standard Devices
The following table shows the various parts of the debugging screen and their functions:
|
Number
|
Element
|
Function
|
|
1
|
Tabs
|
The tab in the foreground indicates the type of screen displayed. In this case, the debug screen.
|
|
2
|
Module area
|
Contains the abbreviated title of the module.
Two LEDs are found in the same area:
-
a green LED indicating that the device is operational (ON/OFF),
-
a red LED indicating an emergency (ON/OFF).
|
|
3
|
Channel area
|
This area allows you to select the communication channel to be debugged.
By clicking on the device, you display the tabs:
-
Description: gives the characteristics of the built-in CANopen port.
-
Inputs/outputs objects: allows pre-symbolizing of the input/output objects.
-
CANopen: allows read/write of SDO.
-
Defaults: accessible in online mode only.
By clicking on the channel, you display the tabs:
-
PDO: enables you to configure the PDOs.
-
Configuration: enables you to declare and configure the CANopen master.
-
Debug: accessible in online mode only.
-
Error control: accessible in online mode only.
This area also has an LED indicating the channel status.
|
|
4
|
General parameters area
|
Recalls the function associated with the channel.
|
|
5
|
Parameters in progress area
|
This area displays the information of an inputs/outputs datum for all the channels. It is divided into 3 columns:
-
the Parameter column displays the inputs/outputs objects and the unmarked objects on which the inputs/outputs datum is mapped,
-
the Label column shows the name of the inputs/outputs datum,
-
the Value column shows the value of the inputs/outputs datum.
|
NOTE: For standard devices, the values are displayed in the following formats:
-
decimal (default),
-
hexadecimal,
-
binary.
To select the format, right-click on a value in the debug screen, then choose the display mode.
For devices with boolean vision (FTB) the value can be forced.
NOTE: In the Value column, when a variable appears in red, it shows that it’s out of range. The range of the variable can be seen by clicking on it. The range is displayed in the status bar.
