|
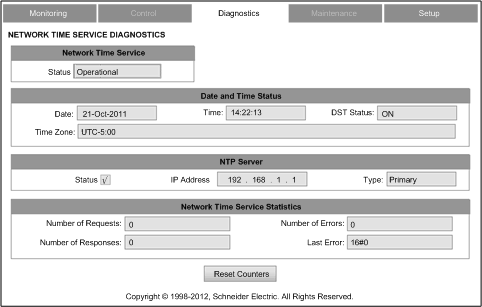
Network Time Service Diagnostics
|
|
|
Original instructions
|

|
Step
|
Action
|
|---|---|
|
1
|
Starting at the Home page, click the Diagnostics main menu item. The Diagnostics page opens.
|
|
2
|
On the left side of the Diagnostics page, select Ethernet → NTP Diagnostics.
|
|
3
|
If necessary, type in the HTTP web access password.
NOTE: The default password is USER. |
|
Parameter
|
Description
|
|
|---|---|---|
|
Network Time Service:
|
||
|
Status
|
Operational status of the service in the module:
|
|
|
Date and Time Status:
|
||
|
Date:
|
System date
|
|
|
Time:
|
System time
NOTE: Red text indicates the network time server is not available. |
|
|
DST Status
|
The actual working status of the automatic daylight savings service:
|
|
|
Time Zone
|
Time zone plus or minus Universal Time, Coordinated (UTC)
|
|
|
NTP Server:
|
||
|
Status
|
Connection status of the NTP server:
|
|
|
IP Address
|
The IP address of the NTP server
|
|
|
Type
|
The NTP server currently active:
|
|
|
Network Time Service Statistics:
|
||
|
Number of Requests:
|
Total number of client requests sent to the NTP server
|
|
|
Number of Responses:
|
Total number of server responses sent from the NTP server
|
|
|
Number of Errors:
|
Total number of unanswered NTP requests
|
|
|
Last Error
|
Last detected error code received from the NTP client:
|
|