Using the Diagnostic Window
Original instructions
Introduction
Use the Diagnostic window to display:
NOTE: Before you can open the Diagnostic window, connect the DTM for the target communication module to the physical module itself. To do this, select the module node in the DTM Browser, then select Edit → Connect.
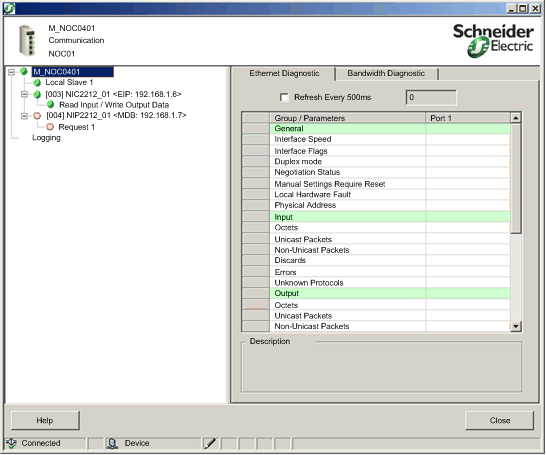
The Diagnostic window looks like this:
To open the Diagnostic window:
Step
Action
1
In the DTM Browser, select the communication module and click the right mouse button. A pop-up menu opens.
2
In the menu, select Device menu → Diagnostic.
Diagnostic LED Icons
During the time that a communication module DTM is connected to the physical communication module, Control Expert sends an explicit message request once per second to detect the state of the communication module and the states of the remote devices and EtherNet/IP connections linked to that module.
Control Expert places one of the following status icons over the module, device or connection nodes in the left pane of the Diagnostic window to indicate its current status:
This icon...
Indicates the following state for a...
Communication module
Connection to a remote device
Run state
The health bit for every EtherNet/IP connection and Modbus TCP request, to a remote device or to a sub-device or module, is set to active (1).
One of the following:
  • unknown
  • started
  • stopped
  • not connected
The health bit for at least one EtherNet/IP connection or Modbus TCP request, to a remote device or to a sub-device or module, is set to inactive (0).