Projecting Ethernet Network Performance
Original instructions
Network Devices
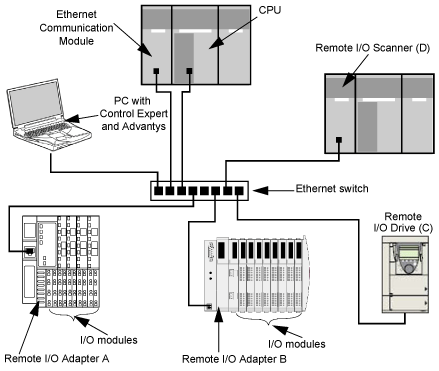
This example estimates the performance for an Ethernet network composed of the following devices:
Control Expert software running in the PC is used to configure the CPU controller.
For programming purposes you need a connection to the PLC either through the CPU's Ethernet port or other supported programming paths.
Network Diagram
The proposed network diagram looks like this:
Network Load and Bandwidth Limits
When performing calculations, keep in mind that the Ethernet module and remote devices cannot exceed their implicit messaging and bandwidth limits:
Device
Load Limits
Bandwidth Limits
Ethernet Communication Module
12000 pps
80 Mbps
I/O Adapter (A)
8000 pps
70 Mbps
I/O Adapter (B)
8000 pps
70 Mbps
I/O Drive (C)
8000 pps
70 Mbps
I/O Scanner (D)
12000 pps
80 Mbps
Switch
16000 pps
90 Mbps
Remote Device Connections and RPI
For the purpose of this example, it is assumed that the remote devices require the following numbers of CIP connections, and are configured for the stated requested packet interval (RPI) settings:
Device
CIP I/O Connections
RPI Setting
I/O Packet Size
I/O Adapter (A)
5
20 ms
8000 bits
I/O Adapter (B)
2
30 ms
4096 bits
I/O Drive (C)
2
30 ms
8000 bits
I/O Scanner (D)
2
50 ms
8000 bits
For the purposes of this example, it is also assumed that every connection is bi-directional.
I/O Scanner Calculations
The Ethernet communication module, acting as local I/O scanner, has to handle the implicit messaging load contributed by the remote devices. Your task is to: 1 estimate the implicit messaging load and bandwidth contributed by each remote device 2 sum the load and bandwidth values for each remote device 3 compare the total load and bandwidth against the maximum implicit messaging capacity of the local I/O scanner
Recall that the implicit messaging load calculation formula for a single remote device is:
Load = (number of packets per connection) x (number of connections) / RPI
Because every connection is assumed to be bi-directional, the number of packets per connection value is 2. Consequently, the estimated implicit messaging load contributed by each device, and the total implicit messaging load the local I/O scanner has to handle can be estimated as follows:
Load:
Device
Number of packets per connection
X
Number of connections
÷
RPI
=
Load
I/O Adapter (A)
2
X
5
÷
20 ms
=
500 pps
I/O Adapter (B)
2
X
2
÷
30 ms
=
134 pps
I/O Drive (C)
2
X
2
÷
30 ms
=
134 pps
I/O Scanner (D)
2
X
2
÷
50 ms
=
  80 pps
                                                                                         Total
=
848 pps
                                                                                         Switch
=
848 pps
Bandwidth:
Device
Packet size
X
Load
=
Bandwidth
I/O Adapter (A)
8000 bits
X
500 pps
=
4 Mbps
I/O Adapter (B)
4096 bits
X
134 pps
=
0.554 Mbps
I/O Drive (C)
8000 bits
X
134 pps
=
1.07 Mbps
I/O Scanner (D)
8000 bits
X
  80 pps
=
0.64 Mbps
                                                                      Total
=
6.26 Mbps
                                                                   Switch
=
6.26 Mbps
Conclusion
The projected total load for the module—848 pps—is within the device implicit messaging limit of 12000 data packets per second. The projected total bandwidth for the communication module—6.26 Mbps—is also within the device implicit messaging bandwidth limit of 80 Mbps. The projected total load and bandwidth for the remote devices (including the switch) are also within their 90% load and bandwidth limits:
Device
90% of Load Limit
90% of Bandwidth Limit
Ethernet Communication Module
10800 pps
72 Mbps
I/O Adapter (A)
7200 pps
63 Mbps
I/O Adapter (B)
7200 pps
63 Mbps
I/O Drive (C)
7200 pps
63 Mbps
I/O Scanner (D)
10800 pps
72 Mbps
NOTE: Although message load contributed by explicit messaging are not included in the above calculations, such load contributions are presumed to be less than 10% of the device load and bandwidth.